OKR Guide

What Is an OKR? Objectives & Key Results Explained

OKR stands for Objectives and Key Results. It's a goal-setting framework used by teams and companies to set an ambitious Objective and track it with two to three measurable Key Results.

Steven Macdonald
By Steven Macdonald, founder of OKRs Tool
Last updated August 2026
A simple example
ObjectiveMake our onboarding the reason customers stay.
  • Key Result 1: Raise 30-day activation from 48% to 70%.
  • Key Result 2: Cut time-to-first-value from 6 days to under 1.
  • Key Result 3: Lift new-customer NPS from 22 to 40.
The anatomy

Objectives, Key Results & Initiatives

Every OKR is built from three parts. Keeping them distinct is what separates a real OKR from a to-do list with ambitions.

Objective

Where you're going

A clear, inspiring, qualitative goal that tells you where to go and why it matters. No number in it — it's the direction, not the measure.

Key Result

How you'll know

A measurable outcome that proves the Objective is being met. Each one moves from a baseline to a target. If you can't put a number on it, it isn't a Key Result.

Initiative

What you'll do

The projects and tasks you believe will move the Key Results. Initiatives are the work, not the goal — you complete them, but you measure the Key Result.
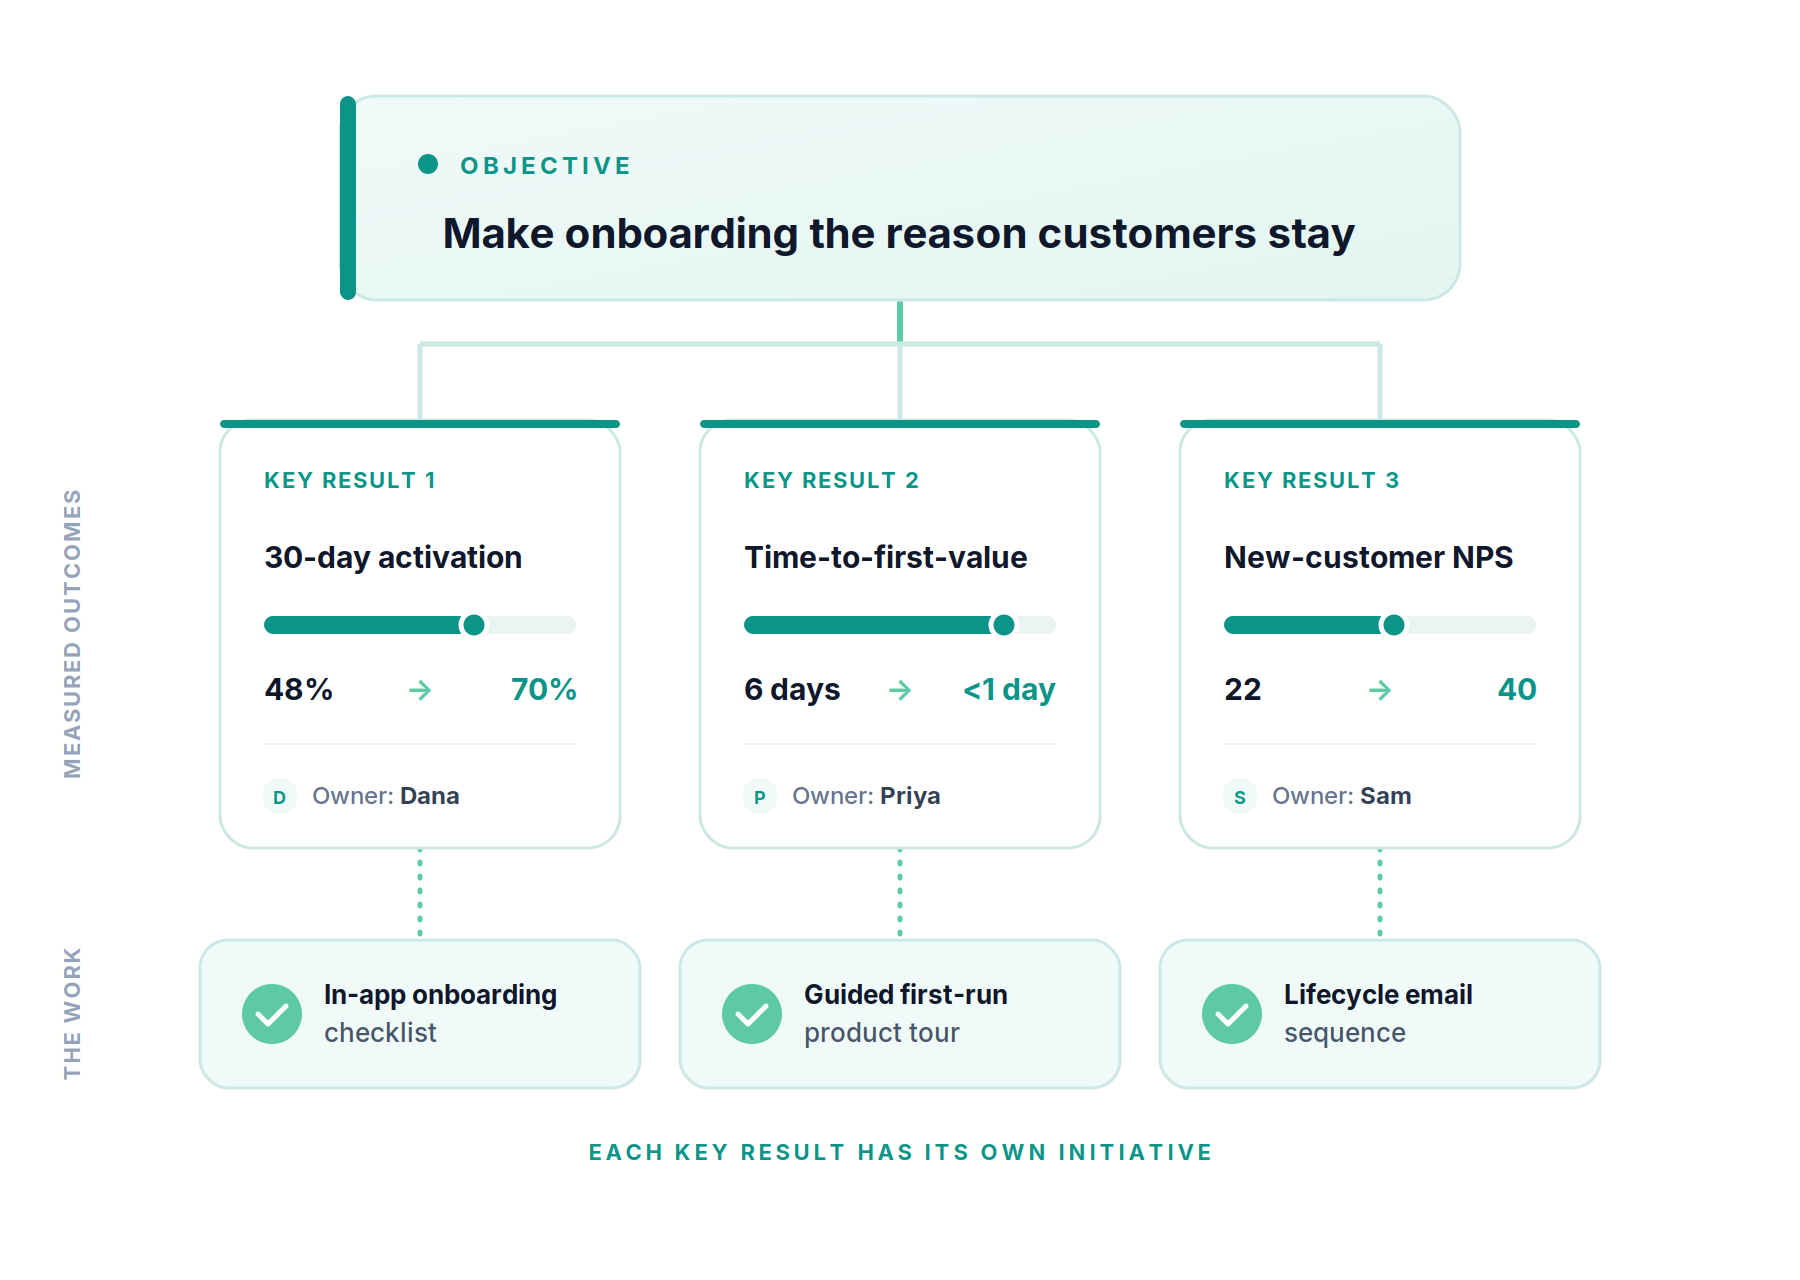
Anatomy of an OKR: an Objective, its Key Results, and the initiatives beneath them
Examples by function

OKR examples for every team

The framework looks a little different in each function. Here's one worked OKR for five teams — each an Objective plus outcome Key Results that move from a baseline to a target. For ready-made starting points, browse our OKR templates by role and function.

Sales
Build a pipeline that doesn't depend on end-of-quarter heroics.
  • Grow qualified pipeline coverage from 2.1x to 3.5x
  • Lift win rate on sourced deals from 18% to 28%
  • Cut average sales cycle from 74 to 50 days
Product
Make the core workflow something users reach for daily.
  • Raise weekly active use from 34% to 55%
  • Increase feature adoption of the new flow from 0 to 40%
  • Cut time-to-first-value from 6 days to <1
Marketing
Turn the site into the team's most reliable pipeline source.
  • Grow organic-sourced SQLs from 40 to 110/mo
  • Lift demo-request conversion from 1.9% to 3.5%
  • Rank top-3 for 5 priority head terms
Engineering
Ship faster without paying for it in reliability.
  • Cut lead-time-to-deploy from 9 days to 2
  • Reduce change-failure rate from 18% to 8%
  • Bring P1 incident recovery from 4 hrs to <1
Customer Success
Make the first 90 days the reason customers renew.
  • Ship self-serve onboarding for the top 10 use cases
  • Lift 90-day activation from 52% to 75%
  • Stand up expansion handoffs: 0 to 40 qualified
The pattern
Every one has the same shape.
  • A qualitative Objective with no number
  • 2–3 Key Results, each baseline → target
  • Outcomes that move, not metrics to hold
The distinction that matters most

OKRs vs KPIs

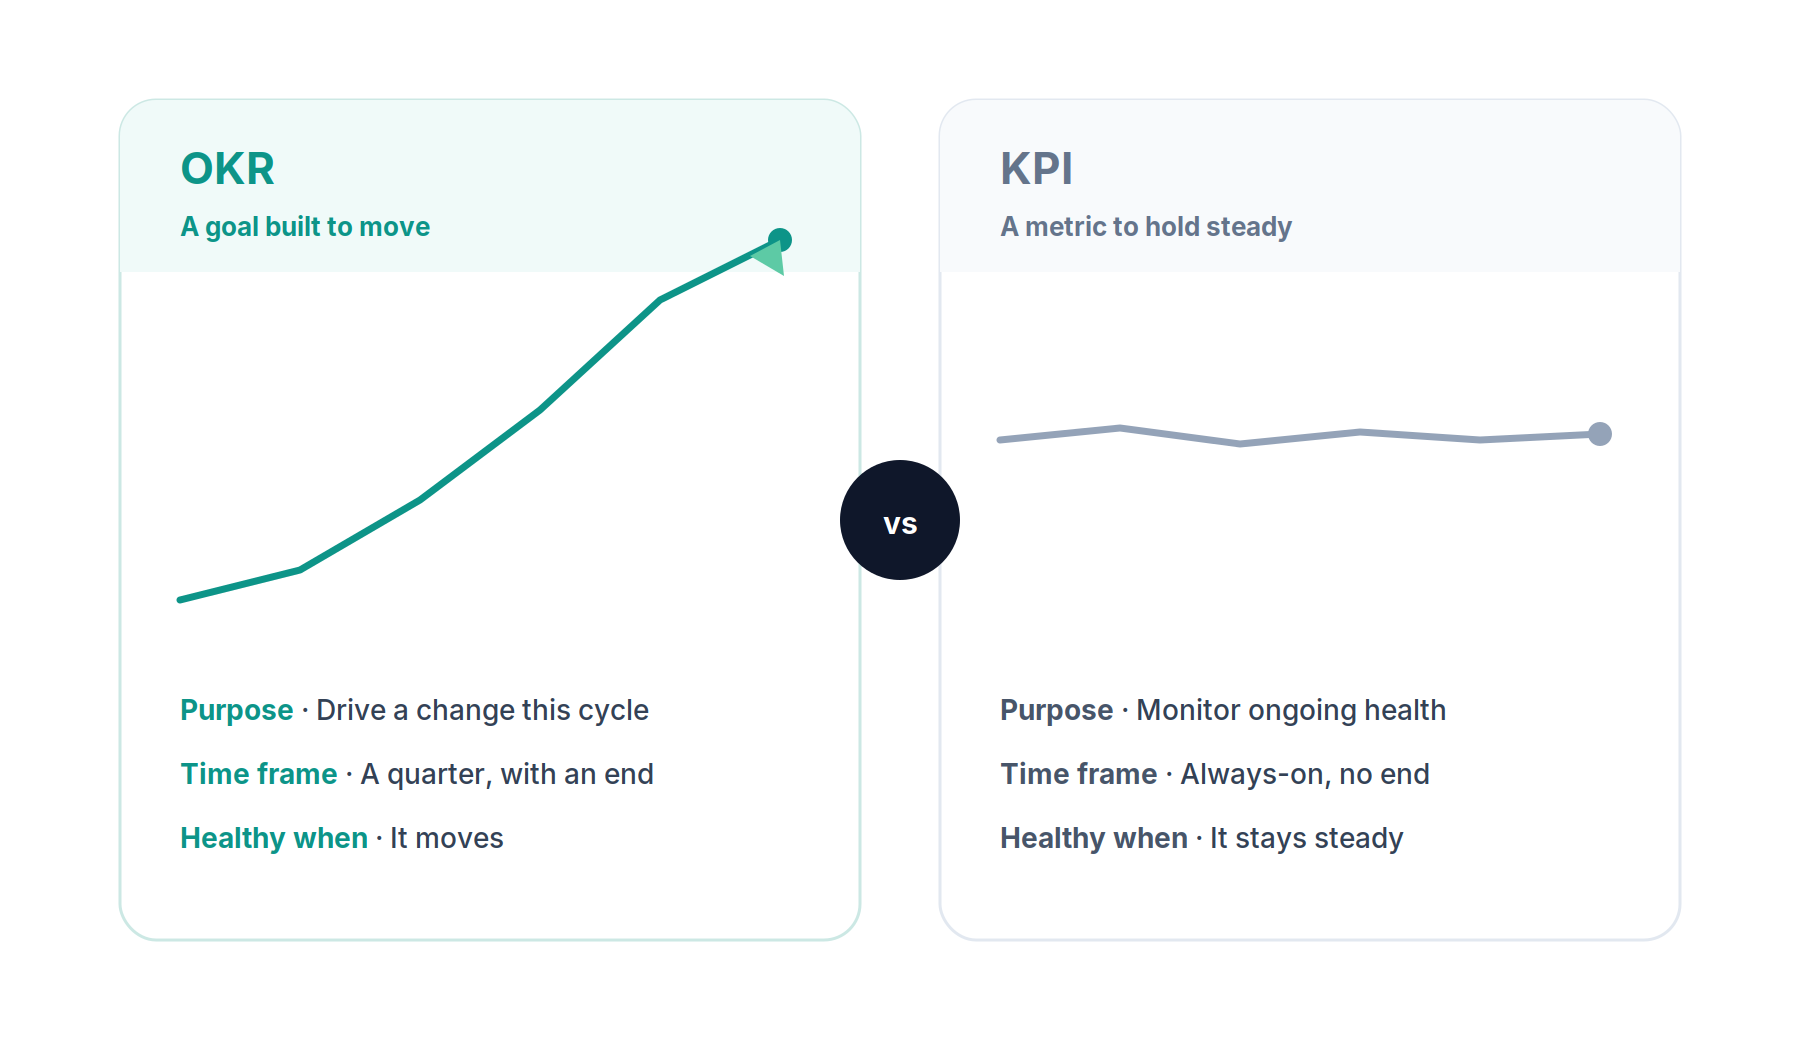
A KPI measures the health of something you're already doing. An OKR is a deliberate push to change something. They work together, but they aren't the same — and confusing them is why so many “OKRs” never change anyone's behaviour.

 OKRKPI
PurposeDrive a specific change this cycleMonitor ongoing health
Time frameA cycle — usually a quarterAlways-on, no end date
AmbitionA stretch you're not sure you'll hitA level you aim to hold
Doing its job whenIt movesIt stays steady
ExampleRaise activation 48% → 70%Keep uptime above 99.9%
OKR vs KPI: an OKR drives change while a KPI holds steady
52%

Across 20,952 Key Results, more than half were really KPIs or tasks in disguise — metrics to hold steady, or work to complete, dressed up as goals to move. When half your Key Results aren't built to move, the framework can't do the one thing it's for.

Source: OKRs Tool 2026 Platform Data · 876 organisations, 20,952 Key Results
How OKRs connect

OKRs by level: company, team & individual

OKRs work as a stack. Company objectives set direction; team OKRs turn that direction into outcomes they own; individual OKRs — where used — connect a person's work to both. Alignment is the thread that runs top to bottom.

CompanyDirection

A small number of company Objectives set the priorities for the whole cycle. They're broad, ambitious, and owned by leadership. Everything below should ladder up to one of them — if it doesn't, it's a sign the work isn't connected to strategy.

TeamOutcomes

Each team writes OKRs that advance a company Objective in their own area. This is where most of the real work lives. Team OKRs cascade from company goals — not copied down, but chosen so that hitting them moves the level above.

IndividualContribution

Individual OKRs are the most contested level — useful for connecting a person's work to the team's outcomes, risky when they turn into a performance-review checklist. Use them to create clarity, not to grade people.
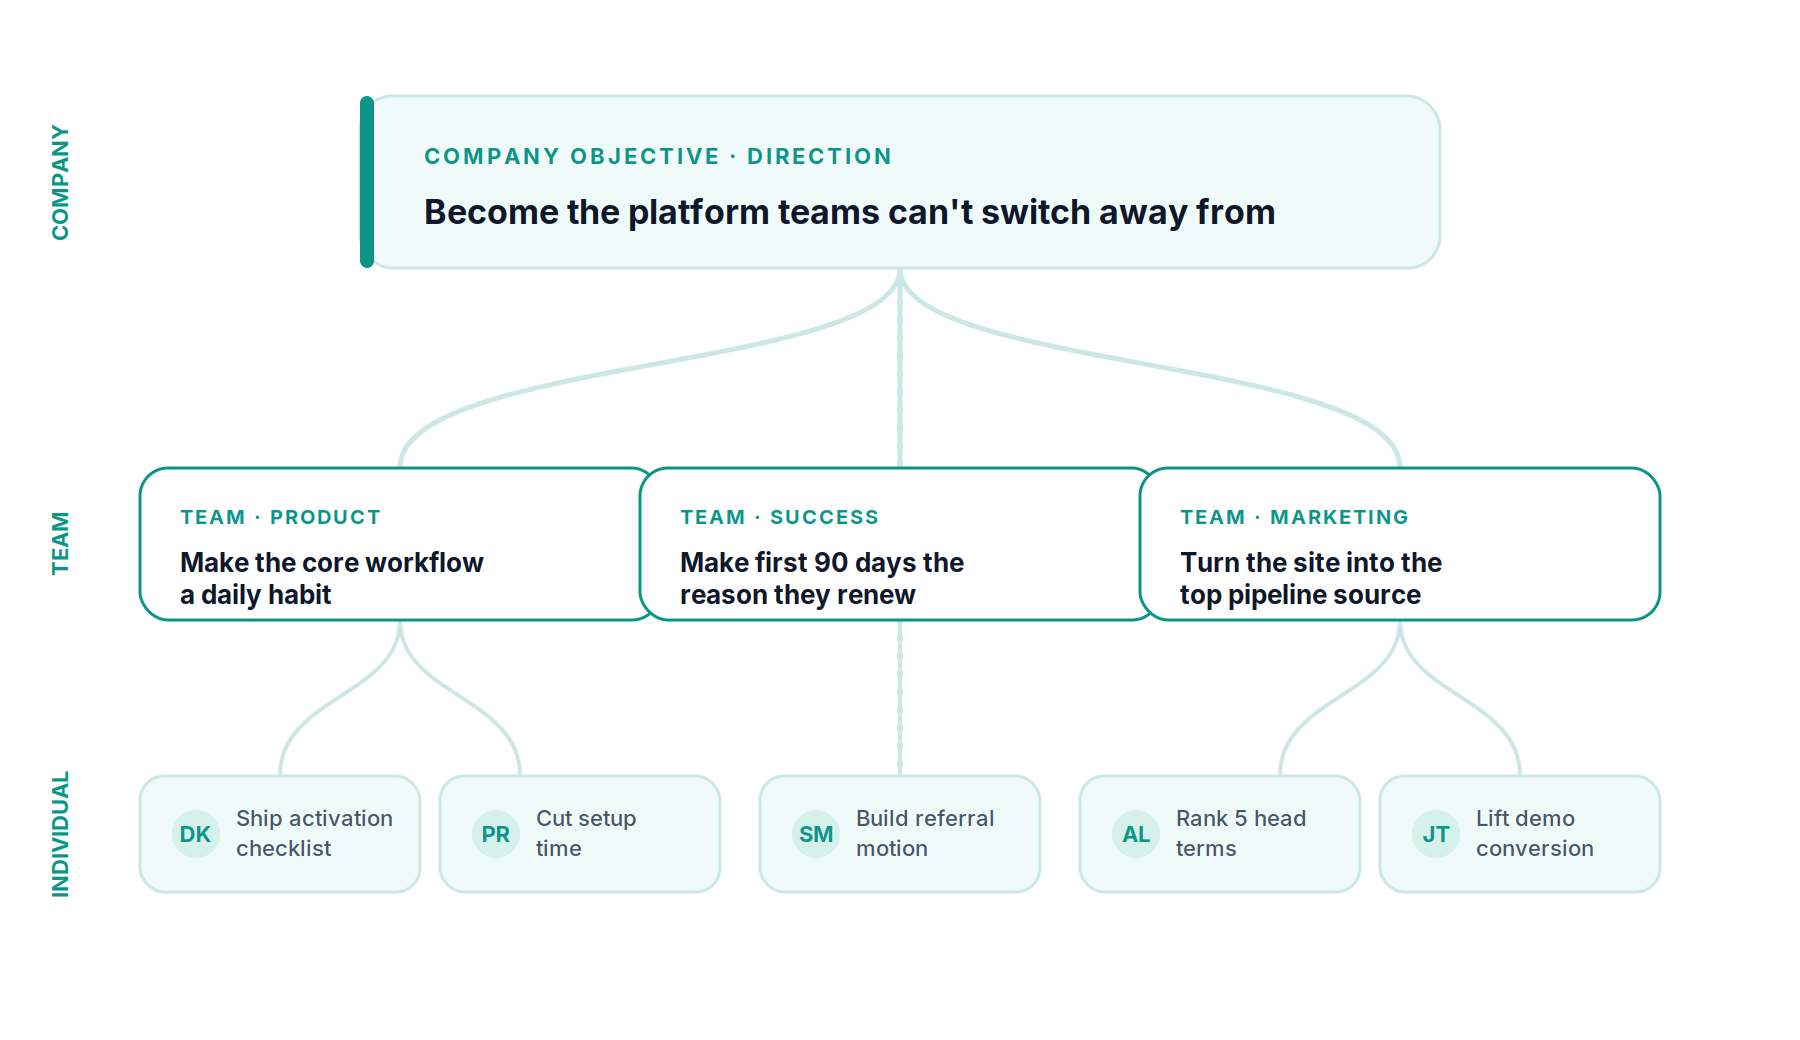
How OKRs cascade and align from company to team to individual level
Why OKRs get a bad reputation

Most OKRs die after the first cycle. Here's why.

In 2017 I rolled out OKRs to a team for the first time. We ran the offsite, wrote the objectives, filled a spreadsheet with key results, and felt organised. By week six the spreadsheet was stale. By quarter-end nobody could tell me which goals we'd hit, because nobody had looked since kickoff. The writing was never the problem; keeping them alive was.

That's the honest reputation problem. Most failed rollouts trace back to one habit: the framework gets treated as a planning exercise — done at the start of a quarter and filed away — instead of an operating rhythm run every week. The writing is the easy part.

The gap between a well-written OKR and a completed one is an execution problem — and, as the data below shows, a measurable one.
1:25

The median return on OKR software across 330 organisations was $25 of value for every $1 spent — from completion lift, time saved on status reporting, and the reduced cost of strategy quietly drifting off track.

Source: ROI of OKRs: 2026 Benchmark Report · 330 organisations

The rest of this guide is about closing that gap: how to write OKRs that can be executed, how to run the cycle that keeps them alive, and what the data says separates the teams that hit their goals from the ones staring at a stale spreadsheet in week six.

Where OKRs came from

A short history of OKRs

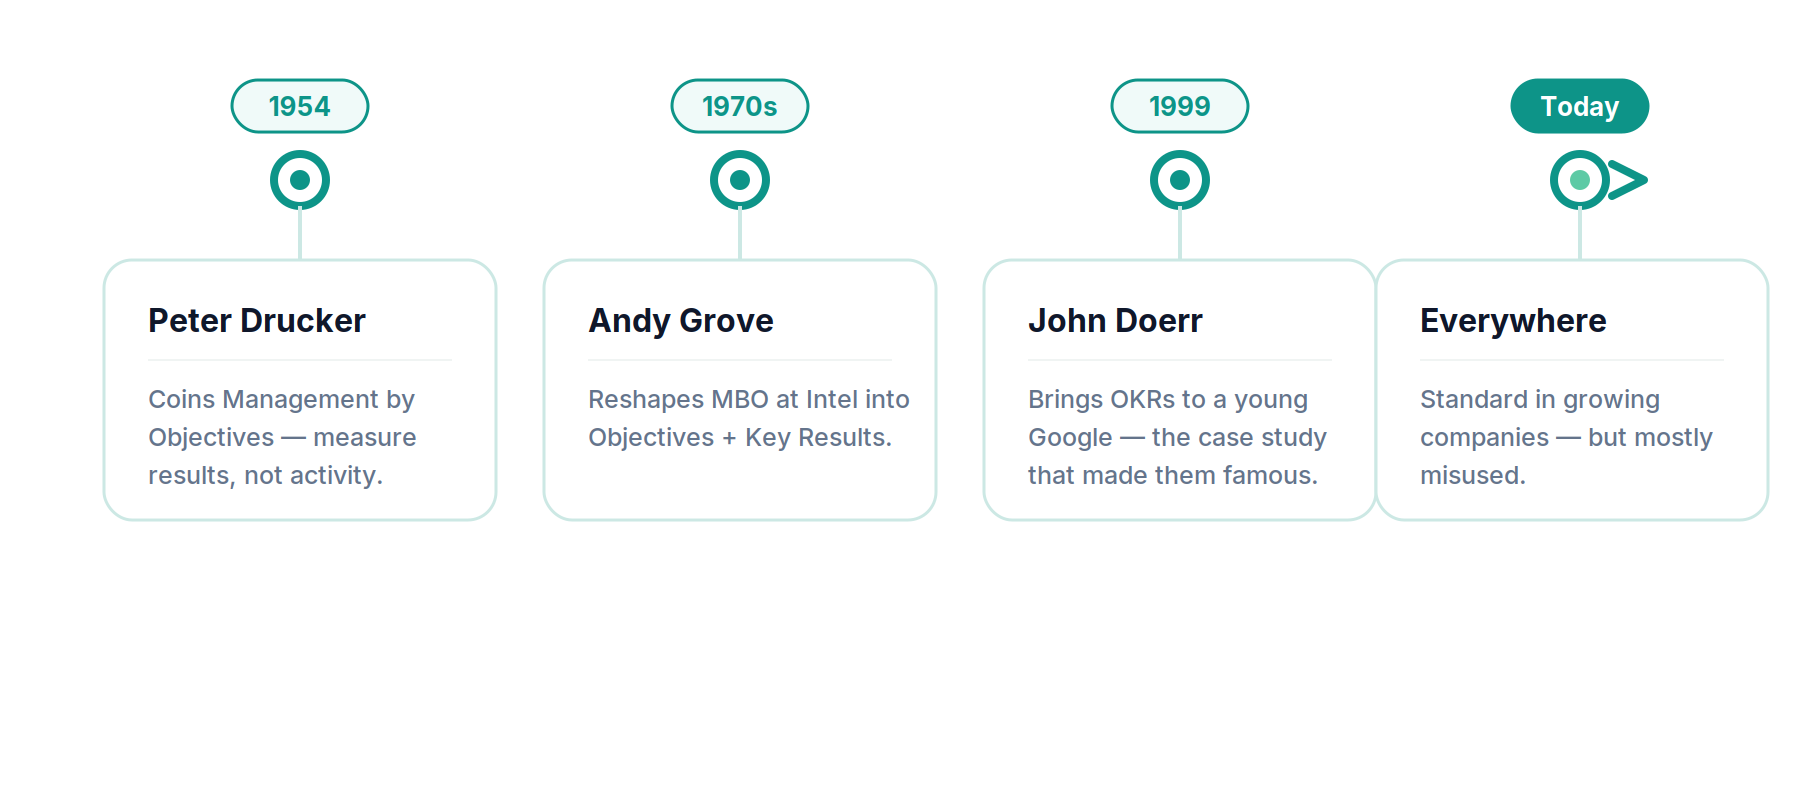
The framework has a clear lineage, and it explains why OKRs are shaped the way they are — a qualitative goal paired with measurable outcomes.

  • 1954
    Peter Drucker — Management by Objectives
    MBO introduced the idea that teams should agree on clear objectives and measure results against them, rather than manage by activity.
  • 1970s
    Andy Grove — OKRs at Intel
    Grove reshaped MBO into the form we'd recognise today — an Objective paired with a few Key Results, run on a short cadence. He turned a planning idea into an operating one.
  • 1999
    John Doerr — OKRs to Google
    Doerr, who learned the method under Grove, brought OKRs to a young Google. The company adopted them company-wide — the case study that made OKRs famous.
  • Today
    Everywhere — and mostly misused
    OKRs are now standard in growing companies, but the method spread faster than the discipline behind it. Which is the rest of this guide.
History of OKRs timeline: Drucker to Grove to Doerr to Google
The instructional core

How to write OKRs that hold up

A good OKR follows a shape. Once you've seen the formula for each part, writing them stops being a blank-page problem.

The Objective formula
I will [Objective] as measured by [Key Results] — a qualitative, memorable goal, proven by the measures beneath it. No number in the Objective itself; if it could be a permanent mission statement, it's too broad.
The Key Result formula
Move [metric] from [baseline] to [target] by [end of cycle] — always a baseline and a target. Two to three per Objective. No baseline and it's a task; no target and it's a wish.
The ownership rule
Every Key Result gets one named owner — a person, never “the team.” It's the most-skipped rule in OKR writing, and the data on skipping it is stark.

Weak vs strong: the same Key Result, rewritten

The most common writing mistake is measuring effort instead of outcome. Here's a weak Key Result and the same intent rewritten to actually move something:

Weak
“Launch the new onboarding flow.”

It's an initiative, not a result. You either ship it or you don't — it can't tell you whether onboarding got better. This is the output trap in one line.

Strong
“Raise 30-day activation from 48% to 70%.”

It's an outcome with a baseline and target. Launching the flow is now an initiative beneath it — the work you do to move the number, not the number itself.

50%

Half of all Key Results have no named owner at all — and Key Results with a single named owner are completed 26% more often than those owned by a group or nobody. Ownership is the difference between a goal someone drives and one everyone assumes someone else is watching.

Source: OKRs Tool 2026 Platform Data · 876 organisations, 20,952 Key Results
Format & structure

The OKR format, laid out

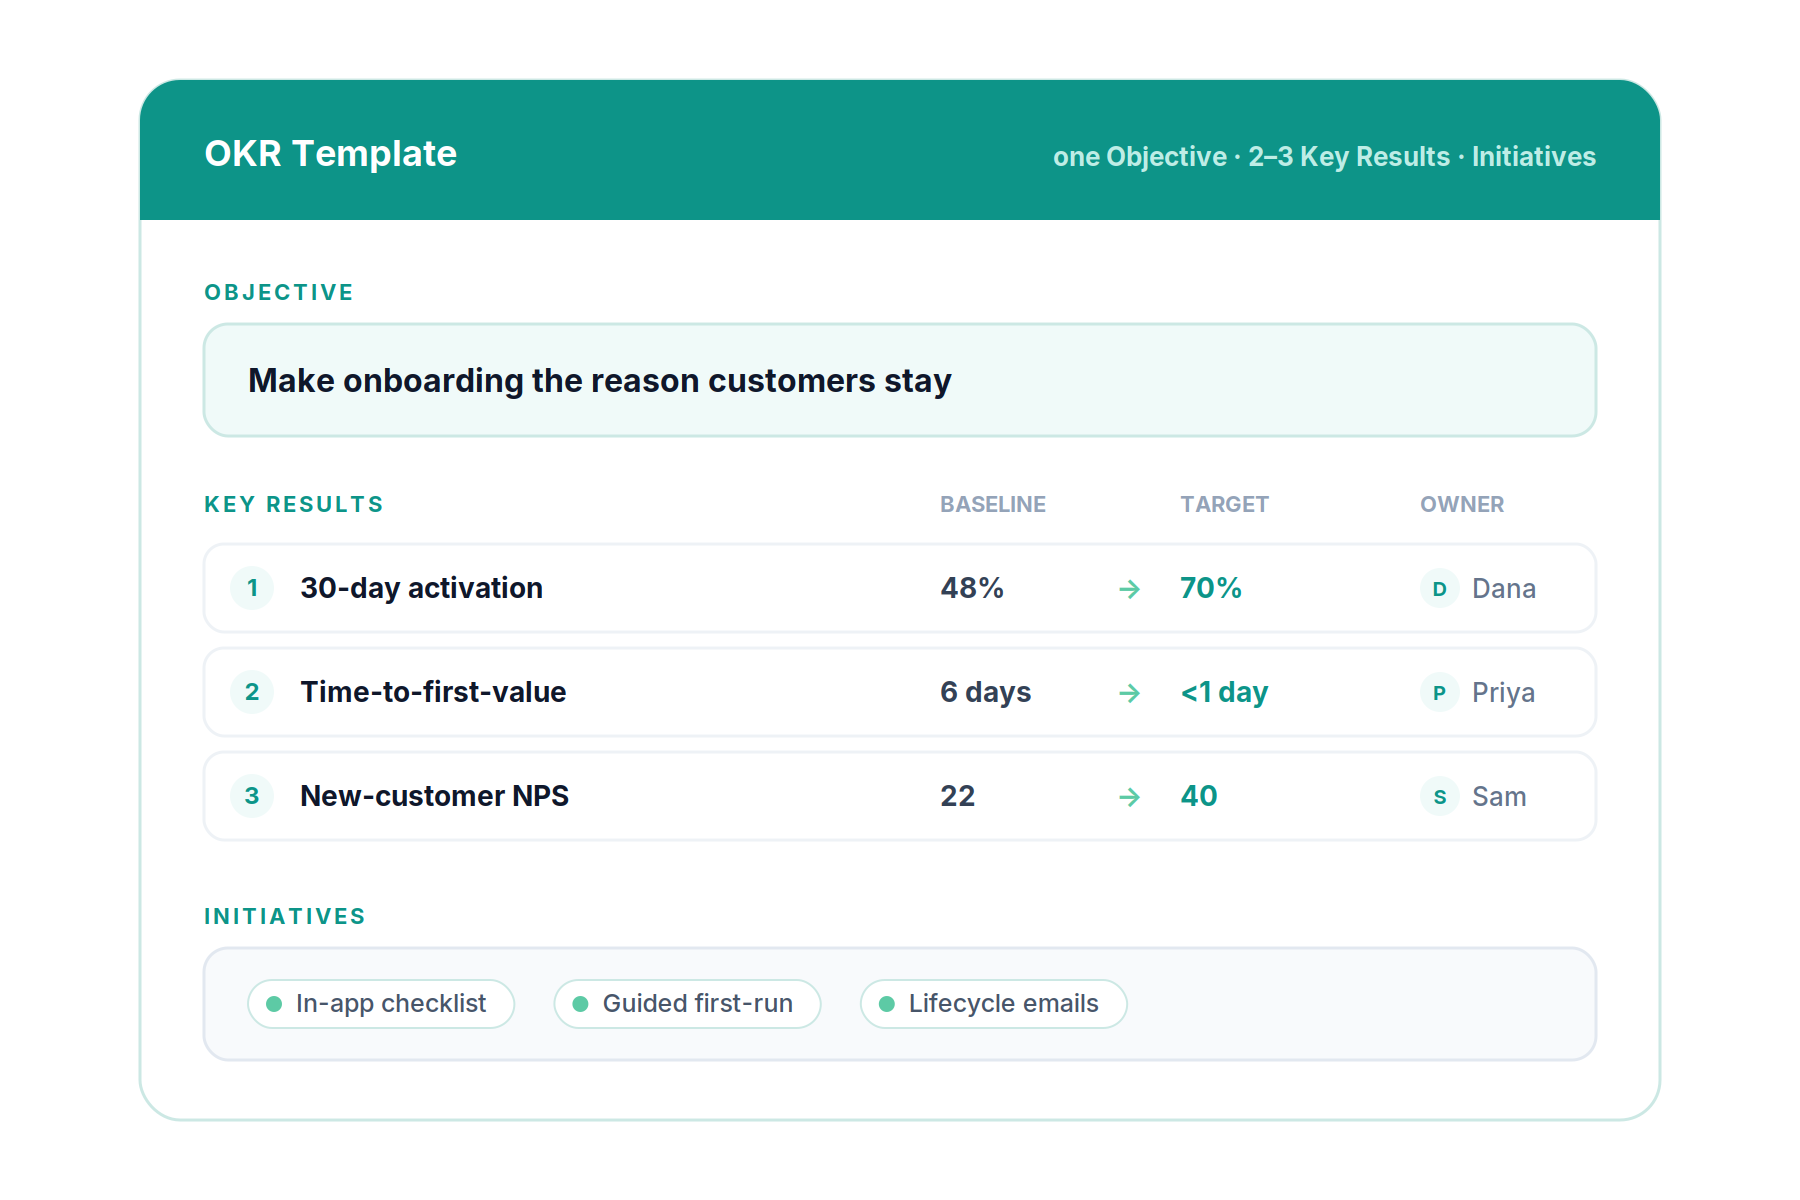
Stripped to its structure, every OKR fits the same simple table. This is the format to copy: one Objective, two to three Key Results with a baseline and target each, and the initiatives underneath.

ElementWhat it isRule of thumb
ObjectiveThe qualitative goal — where you're goingOne per team, no number
Key Result 1A measurable outcome, baseline → targetOwned by one person
Key Result 2A second independent measureMoves, not held steady
Key Result 3A third, if needed — stop at threeMore KRs dilute focus
InitiativesThe projects that move the KRsCompleted, not measured

A useful check: read the Objective and the three Key Results out loud. If the Objective inspires and each Key Result could be argued at quarter-end with a single number, the format is right. If you're explaining what a Key Result “really means,” it isn't measurable enough yet.

The same format, filled in
ObjectiveMake our onboarding the reason customers stay.
Key Result 1Raise 30-day activation from 48% to 70%
Key Result 2Cut time-to-first-value from 6 days to under 1
Key Result 3Lift new-customer NPS from 22 to 40
InitiativesIn-app onboarding checklist · guided first-run · lifecycle email sequence
Free OKR template

The blank format above, as a ready-to-fill Excel or Google Sheets template — plus example OKRs by function.

Get the template →
OKR format template showing an Objective, Key Results with baselines and targets, and initiatives
Not all OKRs are the same

The three types of OKRs

Knowing the three types is why some teams don't feel every goal has to be a moonshot.

Committed

Committed OKRs

Goals you fully intend to hit — the ones you'd escalate if they slipped. Success is 100%, and a miss means something went wrong. For outcomes the business is counting on.

Aspirational

Aspirational OKRs

Stretch goals where landing at 70% is a genuine win. Hard enough that full completion is unlikely, pushing the team past what felt possible. Missing the target is the point.

Learning

Learning OKRs

Goals aimed at answering a question — validating a market, testing a hypothesis. The Key Result is what you learned. Most teams forget these exist; they're how you make an uncertain bet honestly.

How each type is scored: committed OKRs you want at 1.0 — anything less is a miss. Aspirational OKRs are healthy at 0.7–0.8; scoring them 1.0 means the target was too low. Learning OKRs aren't scored on a number at all — success is whether you got the answer.

How OKRs compare

OKRs vs other goal frameworks

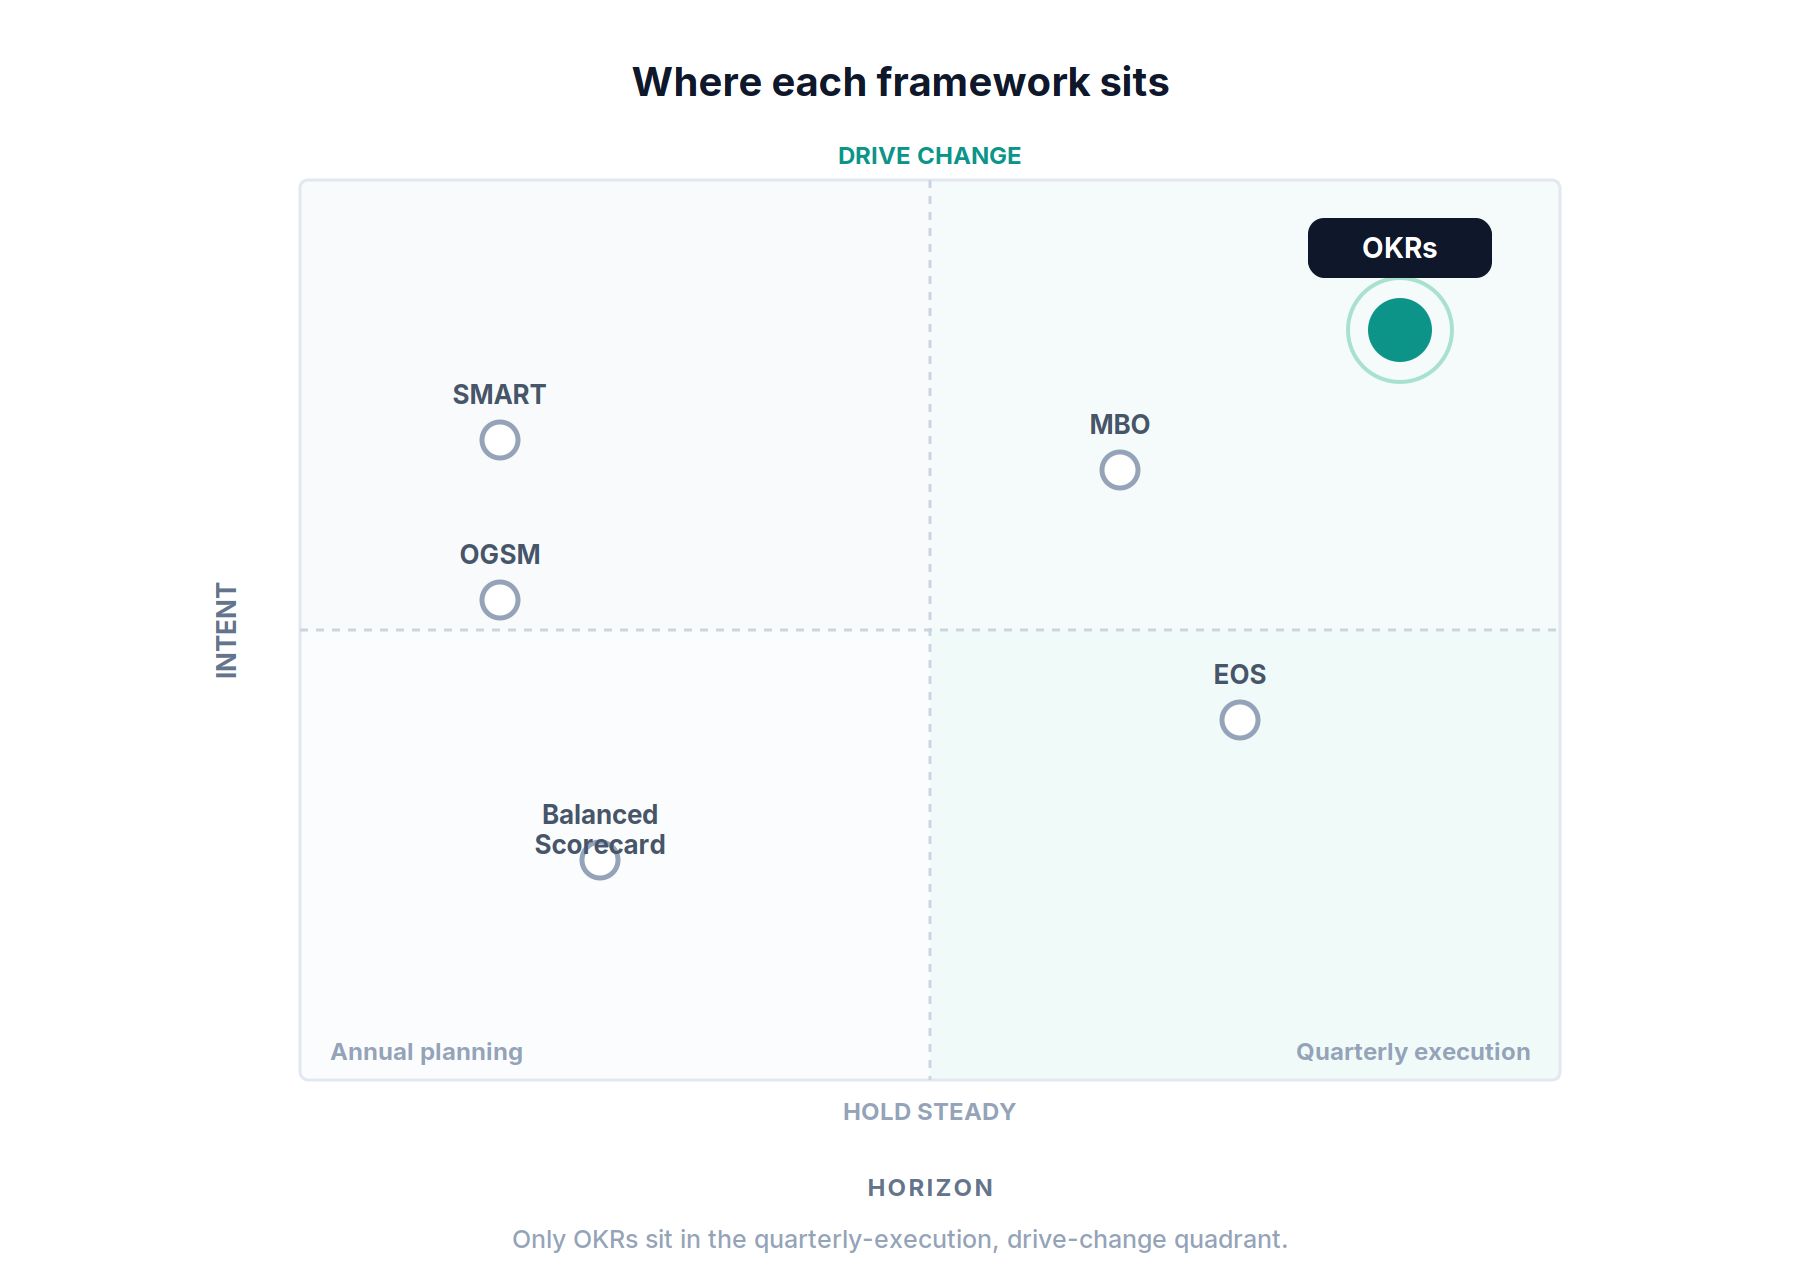
OKRs aren't the only way to set goals. Here's how they sit against the goal-setting frameworks you'll hear compared to them — and when each one fits.

FrameworkWhat it isHow OKRs differ
SMART goalsA checklist for writing one well-formed goal (Specific, Measurable…)SMART shapes a single goal; OKRs add ambition, a cadence, and alignment across a team.
MBOManagement by Objectives — the 1950s ancestor of OKRsOKRs are MBO run faster and more transparently, with public, measurable Key Results.
Balanced ScorecardA top-down view of performance across four fixed perspectivesThe Scorecard monitors steady health (closer to KPIs); OKRs drive change each cycle.
OGSMA one-page plan: Objectives, Goals, Strategies, MeasuresOGSM is an annual planning artifact; OKRs are a quarterly operating rhythm.
EOSAn operating system for small businesses, with quarterly “Rocks”Rocks are priorities to complete; OKRs measure the outcome, not just the work done.
How OKRs compare to SMART goals, MBO, Balanced Scorecard, OGSM and EOS
Running the rhythm

The OKR cycle and how to score

OKRs are an operating rhythm, not a document. The cycle has four beats — and most teams do the first and last and skip the two in the middle that matter most.

1
Plan
Set the Objective and 2–3 Key Results, each with an owner and a target.
2
Track
Check in weekly. Update the numbers. Surface what's stuck while there's time.
3
Score
Grade each KR 0–1.0. For aspirational OKRs, 0.7–0.8 is strong.
4
Reflect
Short retro. What moved, what didn't, what carries forward.

Grade each Key Result 0 to 1.0 by how far it moved from baseline to target. For aspirational OKRs, always scoring 1.0 means the targets were too low — the 0.7 to 0.8 range is the sign of a goal that stretched the team. Committed OKRs are the exception; those you want at 1.0. But the beat that decides everything is track — the weekly check-in almost everyone skips.

43%

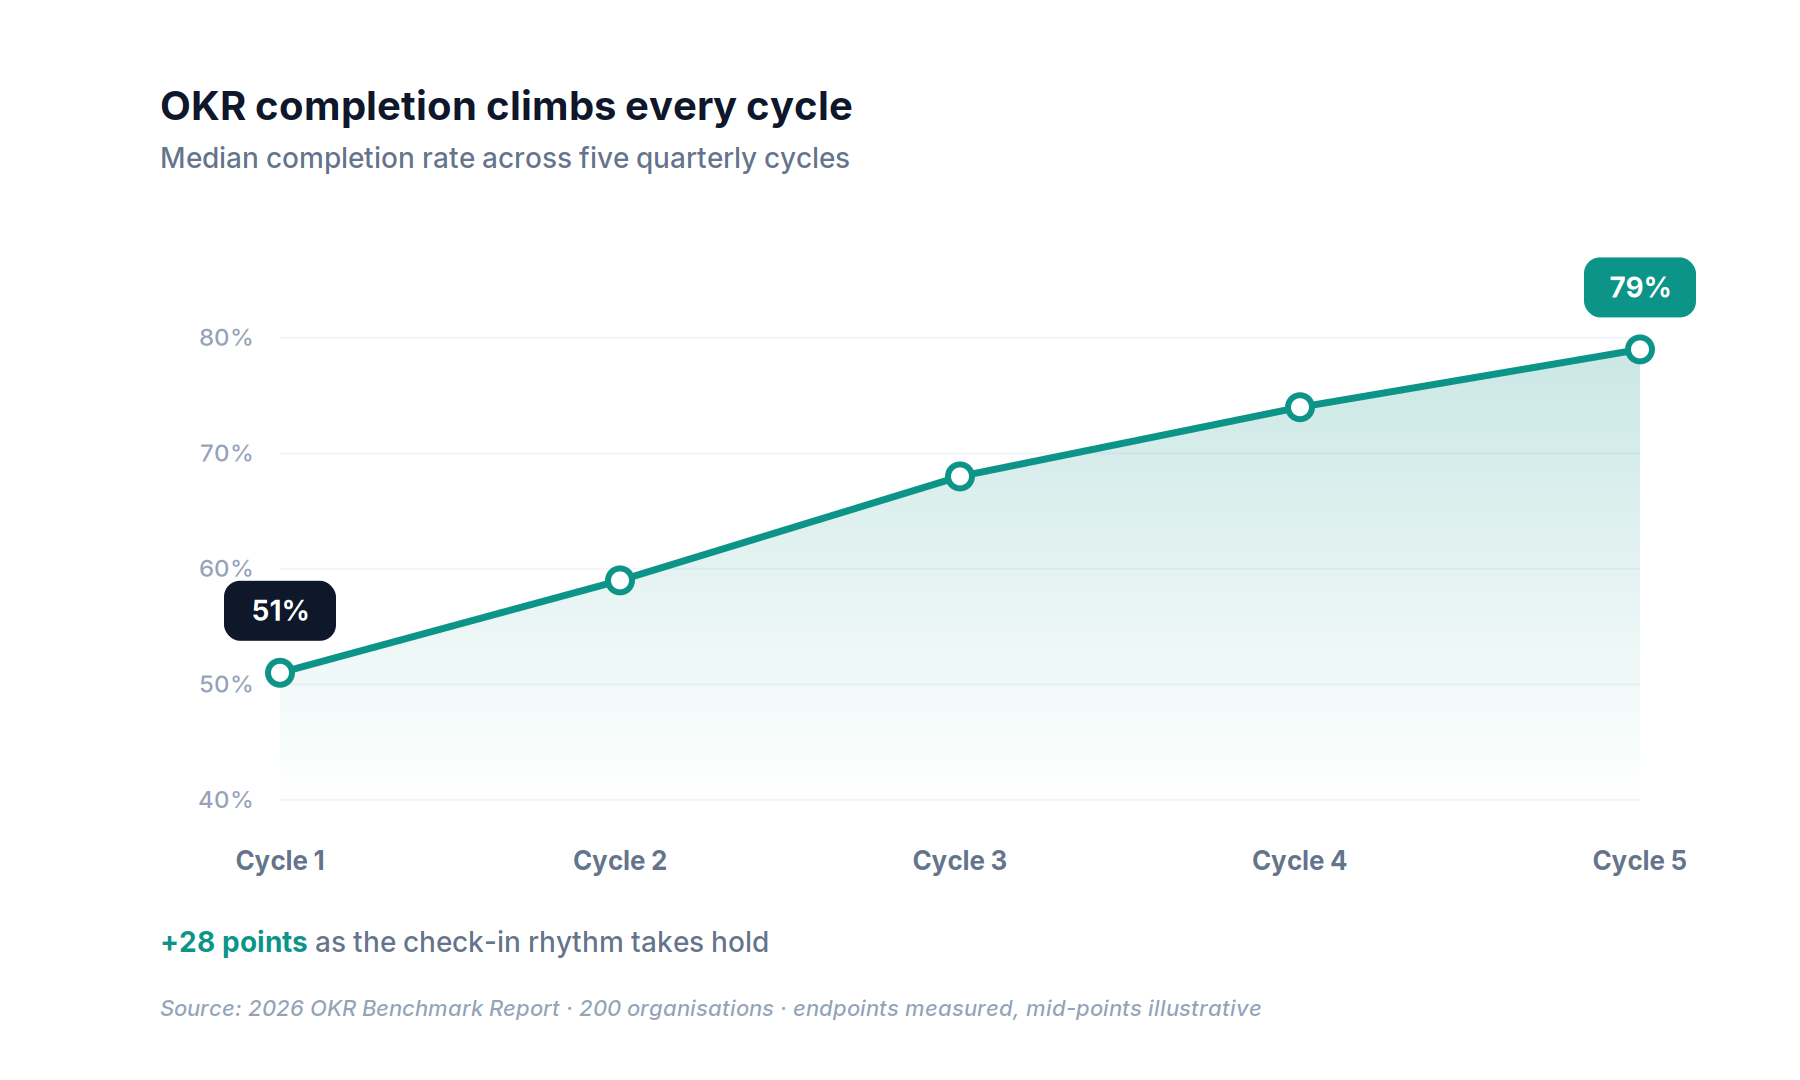
Teams that check in weekly complete 43% more of their OKRs than teams checking in monthly or ad-hoc — and it compounds: completion climbs from 51% in early cycles to 79% by the fifth as the rhythm takes hold.

Source: 2026 OKR Benchmark Report · 200 organisations
OKR completion rate rising from 51% to 79% across five cycles
The execution gap

Why OKRs fail

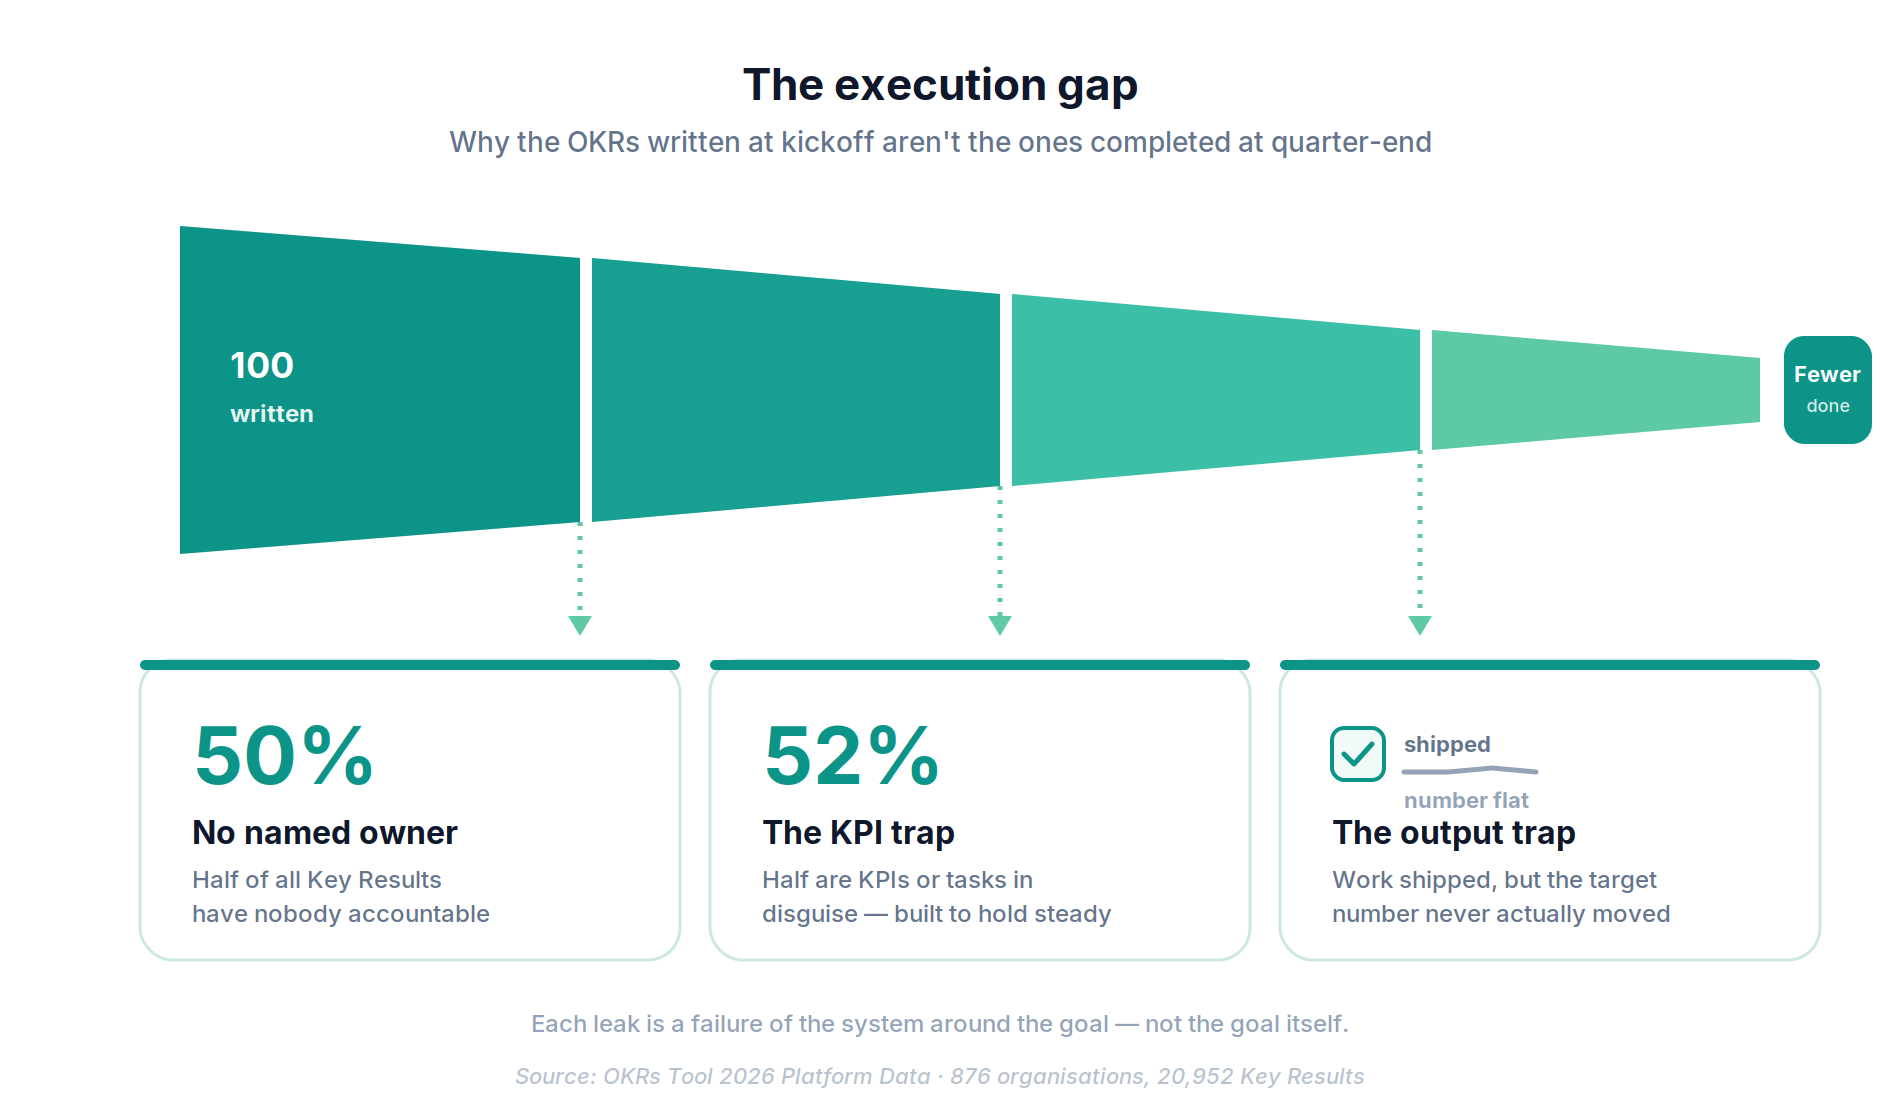
Nearly every failed rollout dies from one of three specific, measurable failures. All three share a root: they happen after the goal is written, not when it's chosen.

01

Goals without owners

When a Key Result belongs to everyone, it belongs to no one. Half of all Key Results have no named owner, and unowned goals are the first to go stale.

02

The KPI trap

If a Key Result is really a health metric to hold steady, it can't drive change. More than half of Key Results are KPIs or tasks in disguise — already failed at the one thing an OKR is for.

03

The output trap

Measuring initiatives (“shipped it”) instead of outcomes (“it moved the number”) ends the quarter busy and unchanged. Completing the work isn't hitting the goal.

The OKR execution gap: three failure modes that drain OKRs between written and completed

All three are failures of the system around the goal, not the goal itself. Which is why the fix isn't “write better OKRs” — it's running them in something built to enforce ownership, keep the numbers current, and show whether the work is moving the outcome.

Anti-patterns

The most common OKR mistakes

Beyond the three structural failures, a handful of predictable mistakes show up in almost every struggling rollout. If your OKRs feel like busywork, one of these is usually why.

Too many OKRs

Five objectives with six Key Results each isn't ambition — it's a to-do list. Focus is the whole point; cap it (see the FAQ below for the number).

Sandbagging the targets

Setting targets you know you'll hit to protect a review score. It guarantees 100% completion and guarantees the goals never stretch anyone.

Tying OKRs to compensation

The fastest way to kill ambition. The moment bonuses ride on the score, people negotiate for easy targets — and the framework stops measuring anything real.

Set-and-forget

Writing OKRs at kickoff and never looking again until quarter-end. Without the weekly check-in, they're a planning artifact, not an operating system.

Measuring output, not outcome

“Shipped the feature” is an initiative. “The feature moved the number” is a Key Result. Confusing the two is the most common wording mistake.

Cascading by copy-paste

Handing objectives down unchanged so every team has the same goal. Real cascade means each level chooses OKRs that move the level above, not mirror it.

What's changed in 2026

AI and OKRs

This is the newest shift in how OKRs get run, and most guides haven't caught up. AI has arrived in the workflow fast — but adoption has raced ahead of trust, and the teams getting real value are using it for something specific.

83%

of organisations now use AI somewhere in their OKR process. But only a small fraction trust the output enough to use it unedited — the tooling is being adopted faster than the confidence in it.

Source: OKR Intelligence Report 2026 · 222 organisations

The split that matters is writing vs analysis. Most teams use AI to draft objectives; fewer use it for mid-cycle analysis — and that's where the return concentrates. Teams using AI for both writing and analysis accept a low score on a missed goal only 14% of the time, versus 35% for teams using it to write only. The analysis layer is what compounds.

What makes this more than a trend is that the best AI uses attack the exact failure modes from earlier on this page:

Outcome-first drafting

AI that drafts Key Results from outcomes, not activity, directly counters the 52% output-trap — turning “launch the flow” into “move activation to 70%.”

At-risk flagging

Surfacing a Key Result that's gone quiet before quarter-end fights the staleness of unowned goals — the failure that half of all KRs are exposed to.

Cycle synthesis

End-of-cycle pattern analysis across check-ins is the antidote to set-and-forget — it makes the retro real instead of a rushed guess.

The buyer's real concern isn't capability — it's privacy. AI in your OKR process means your strategy, targets, and check-in commentary pass through a model. Before you turn it on, know where that data goes, whether it trains anything, and whether it stays inside your workspace. Useful AI that leaks strategy isn't useful.
Choosing OKR software

What to look for in OKR software

Everything above points at the same conclusion: the goals aren't the hard part — keeping them alive is. So evaluating OKR software really means checking whether it fixes the three failures from the last section. That narrows it to three must-haves.

1

Automated weekly check-ins

The weekly cadence is worth 43% more completions, so the tool has to make checking in effortless — nudges, not nagging — so numbers stay current without chasing.

2

Required ownership

Unowned Key Results go stale and single ownership lifts completion 26%, so a named owner should be mandatory, not optional. If a KR can exist with no owner, the tool is letting the most common failure in.

3

Alignment visibility

The output trap hides in disconnected goals, so you need to see how every Key Result ladders to a company objective — work that isn't moving an outcome should be visible, not buried.

Spreadsheets vs enterprise vs purpose-built

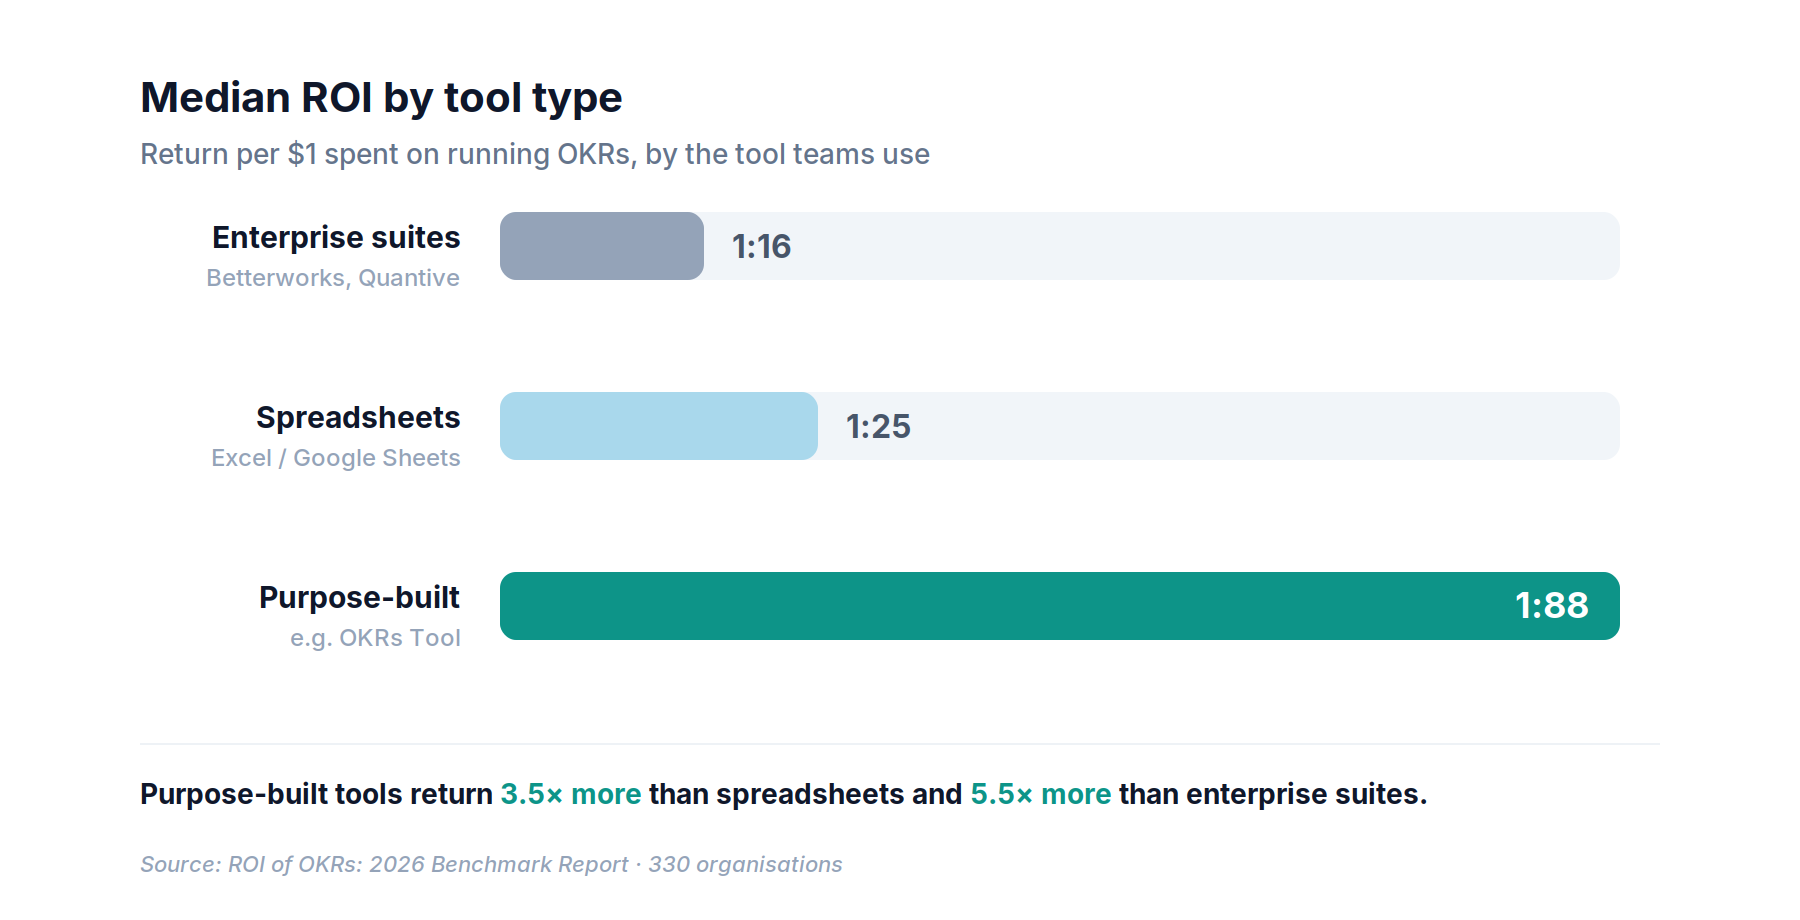
“Best OKR software” really means matching the tool to the job. The ROI data splits cleanly by tool type — and the gap is not cosmetic.

Median ROI of OKRs by tool type: enterprise 1:16, spreadsheets 1:25, purpose-built 1:88

Enterprise suites carry overhead that a 50–200 person team pays for but doesn't use; spreadsheets can't enforce the three must-haves above. Purpose-built tools return the most precisely because they're built to do the three things that close the execution gap — which is what the must-haves below describe in practice.

+50%

One more thing worth knowing before you buy: teams that got their first cycle live in under a week completed 50% more of their OKRs than teams whose rollout dragged. A rollout that stalls before cycle one is the most common way OKRs never start at all.

Source: 2026 OKR Benchmark Report · 200 organisations

Run OKRs that survive cycle two.

OKRs Tool closes the execution gap — required ownership, automated weekly check-ins, and a live alignment map. Set up in an afternoon, no consultants.

Free for up to 5 users · Flat pricing, never per user · No credit card
Common questions

OKR FAQ

01What is an OKR vs a KPI?
A KPI is a metric you monitor to track the ongoing health of something you're already doing — it's meant to stay steady. An OKR is a goal built to drive a specific change this cycle — it's meant to move. KPIs tell you if things are okay; OKRs push things forward.
02What is the meaning of OKR?
OKR stands for Objectives and Key Results. It's a goal-setting framework where you set one ambitious, qualitative Objective — where you want to go — and track it with two to three measurable Key Results that prove whether you got there. It was shaped at Intel and made famous by Google.
03What are some examples of OKRs?
An Objective might be “Make onboarding the reason customers stay.” Its Key Results could be: raise 30-day activation from 48% to 70%, cut time-to-first-value from 6 days to under 1, and lift new-customer NPS from 22 to 40. The Objective sets direction; each Key Result moves from a baseline to a target.
04What is the difference between an OKR and a goal?
A goal is any desired outcome, stated however you like. An OKR is a specific structure for a goal: a qualitative Objective paired with two to three measurable Key Results, each moving from a baseline to a target within a set cycle. Every OKR is a goal, but a goal only becomes an OKR when it has that measurable structure and a time frame.
05How many OKRs should a team have?
Two to three Objectives per team per cycle, with two to three Key Results each. That's the ceiling, not a target — more than that and focus collapses, which defeats the point of the framework. If everything is a priority, nothing is. Fewer, well-owned OKRs beat a long list every time.
06Should OKRs be tied to bonuses or performance reviews?
Most experts advise against it — the moment pay rides on the score, people set targets they know they can hit, and ambition disappears. Yet 75% of organisations have formally linked OKR outcomes to performance decisions, which is a big reason sandbagging is so widespread. Keep scoring honest by keeping it separate from compensation.

About the data on this page. The figures cited come from OKRs Tool's own research programmes: the 2026 Platform Data report (876 organisations, 20,952 Key Results), the 2026 OKR Benchmark Report (200 organisations), the ROI of OKRs Benchmark (330 organisations), and the State of Goal Management Report (210 employees). Explore all reports in our Research Hub.