See a goal slipping while you can still act.
See how your pace stacks up against high performers, which goals are on track to miss, and where momentum is shifting — read the whole cycle at a glance, without assembling a single report by hand.
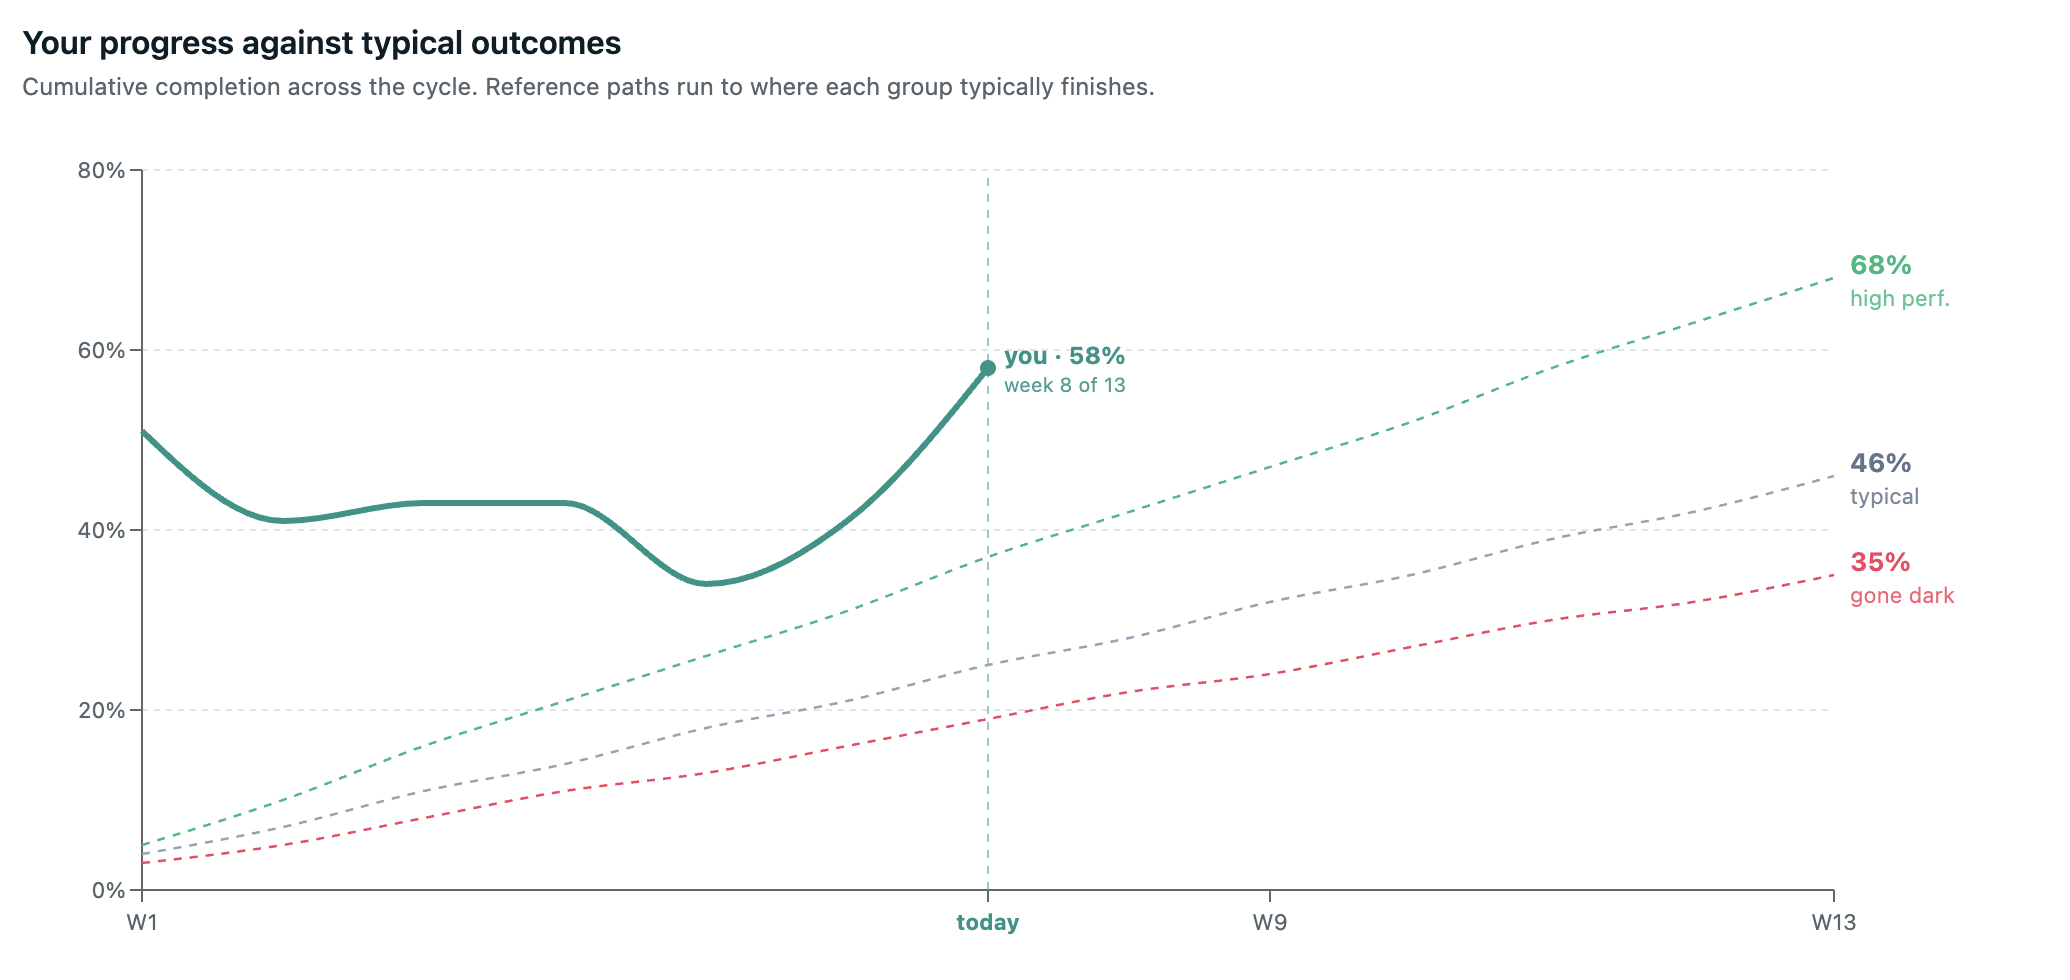
See how you stack up against high performers.
Your OKR progress plotted against high performers, typical teams, and those who've gone dark — week by week across the cycle. Know exactly where you stand, and what trajectory you're on, before the quarter ends.
- Your pace vs high performers, typical, and dark teams
- Plotted week by week, not point-in-time
- See your trajectory, not just today's number
- Built from behavioural benchmark data
See which goals will miss — before they do.
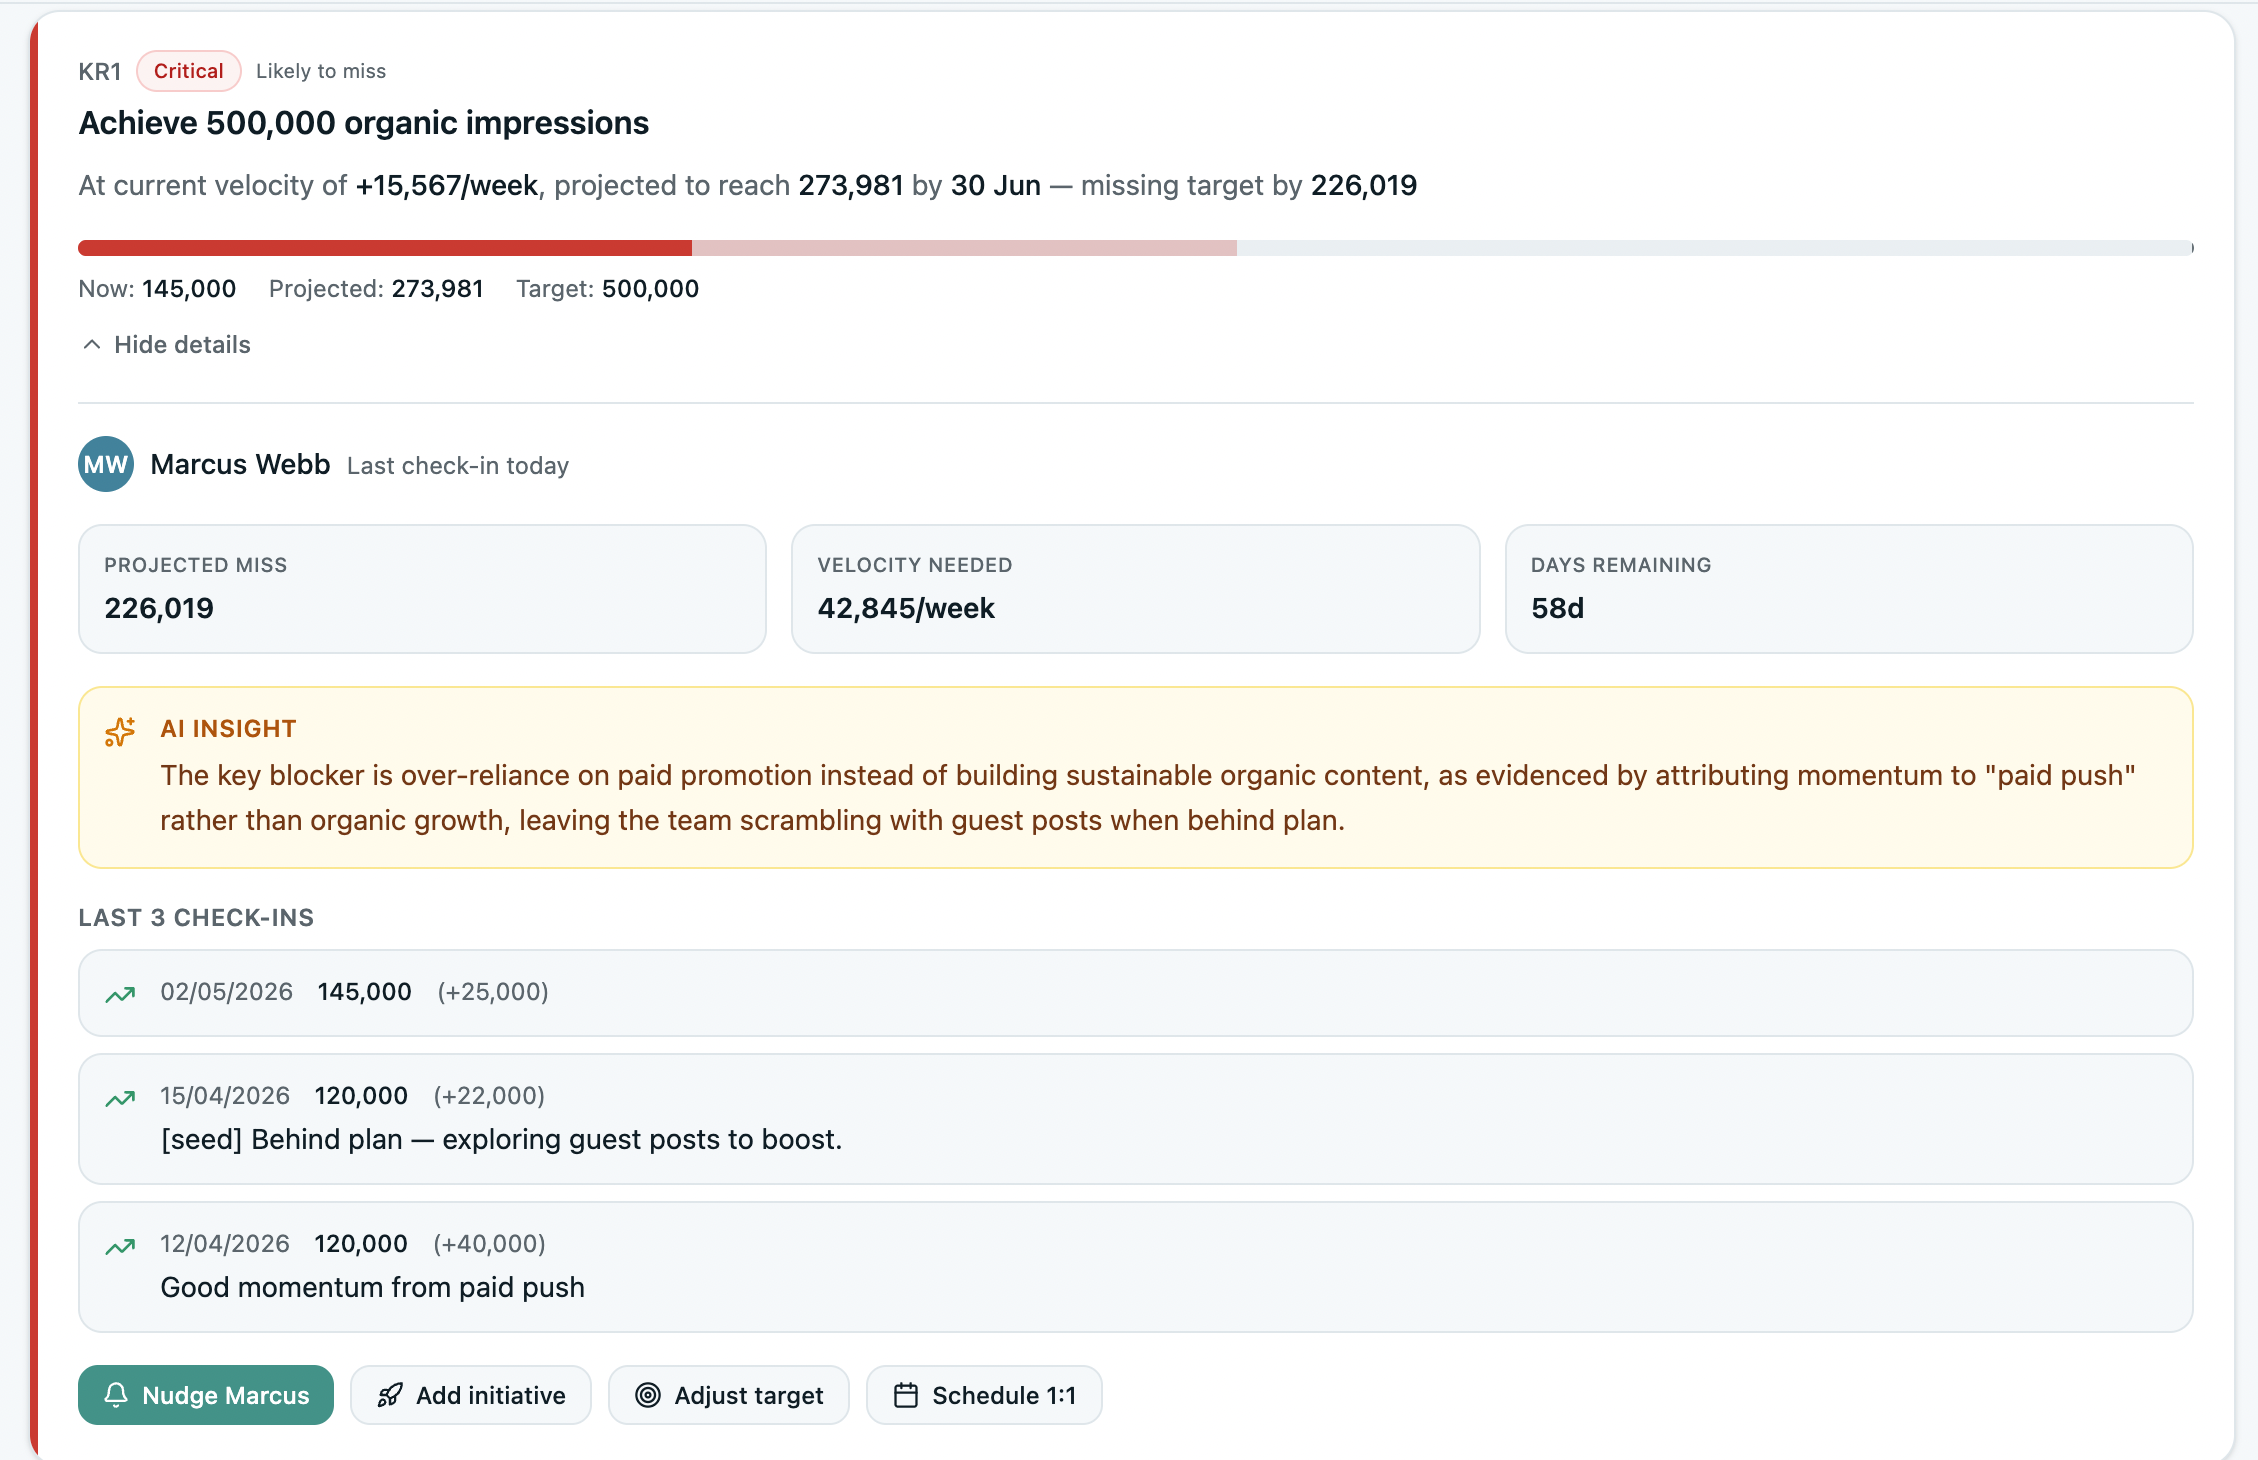
A forward-looking report, updated daily, that projects where every Key Result is heading from its check-in history. At current velocity, projected to reach 75% by 30 Sept — missing by 25% — the read you'd otherwise only get at the post-mortem.
- Critical, high, and medium risk, sorted automatically
- Projects the finish position from real velocity
- Flags KRs with too little data to trend
- Updated daily — act while there's still time
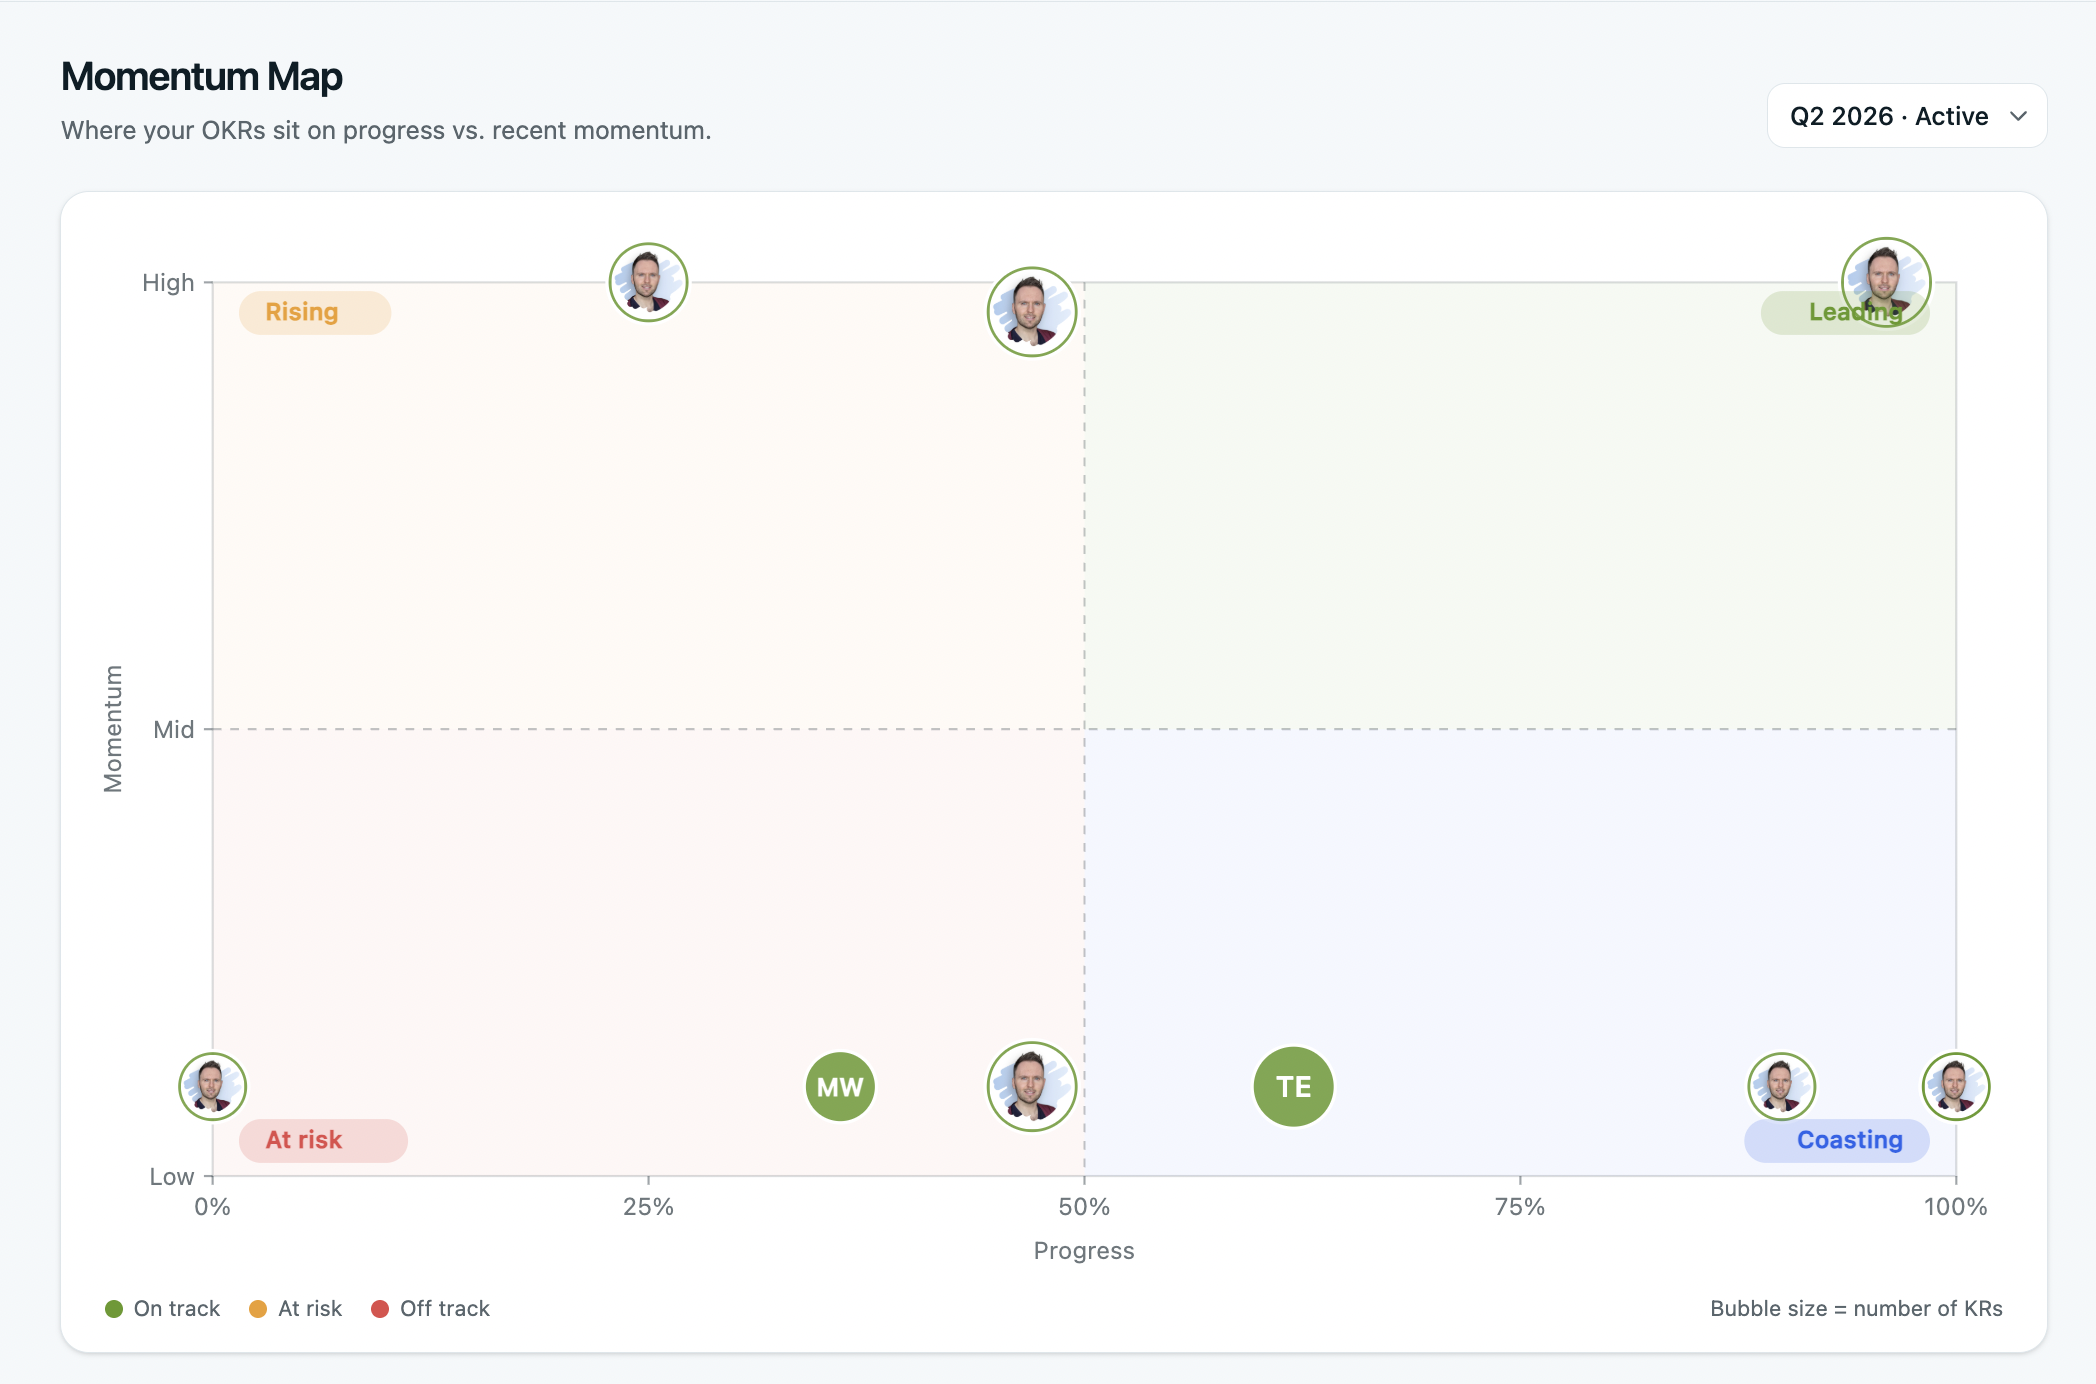
Who's leading, rising, coasting, or at risk.
See where every OKR sits across progress and momentum on a single chart. One view tells you where to focus, who needs support, and what's quietly slipping — without digging through dashboards.
- Every OKR plotted on progress × momentum
- Spot leading, rising, coasting, and at-risk
- See what's slipping before it's too late
- One chart instead of a dashboard crawl
Board-ready readouts, without the prep.
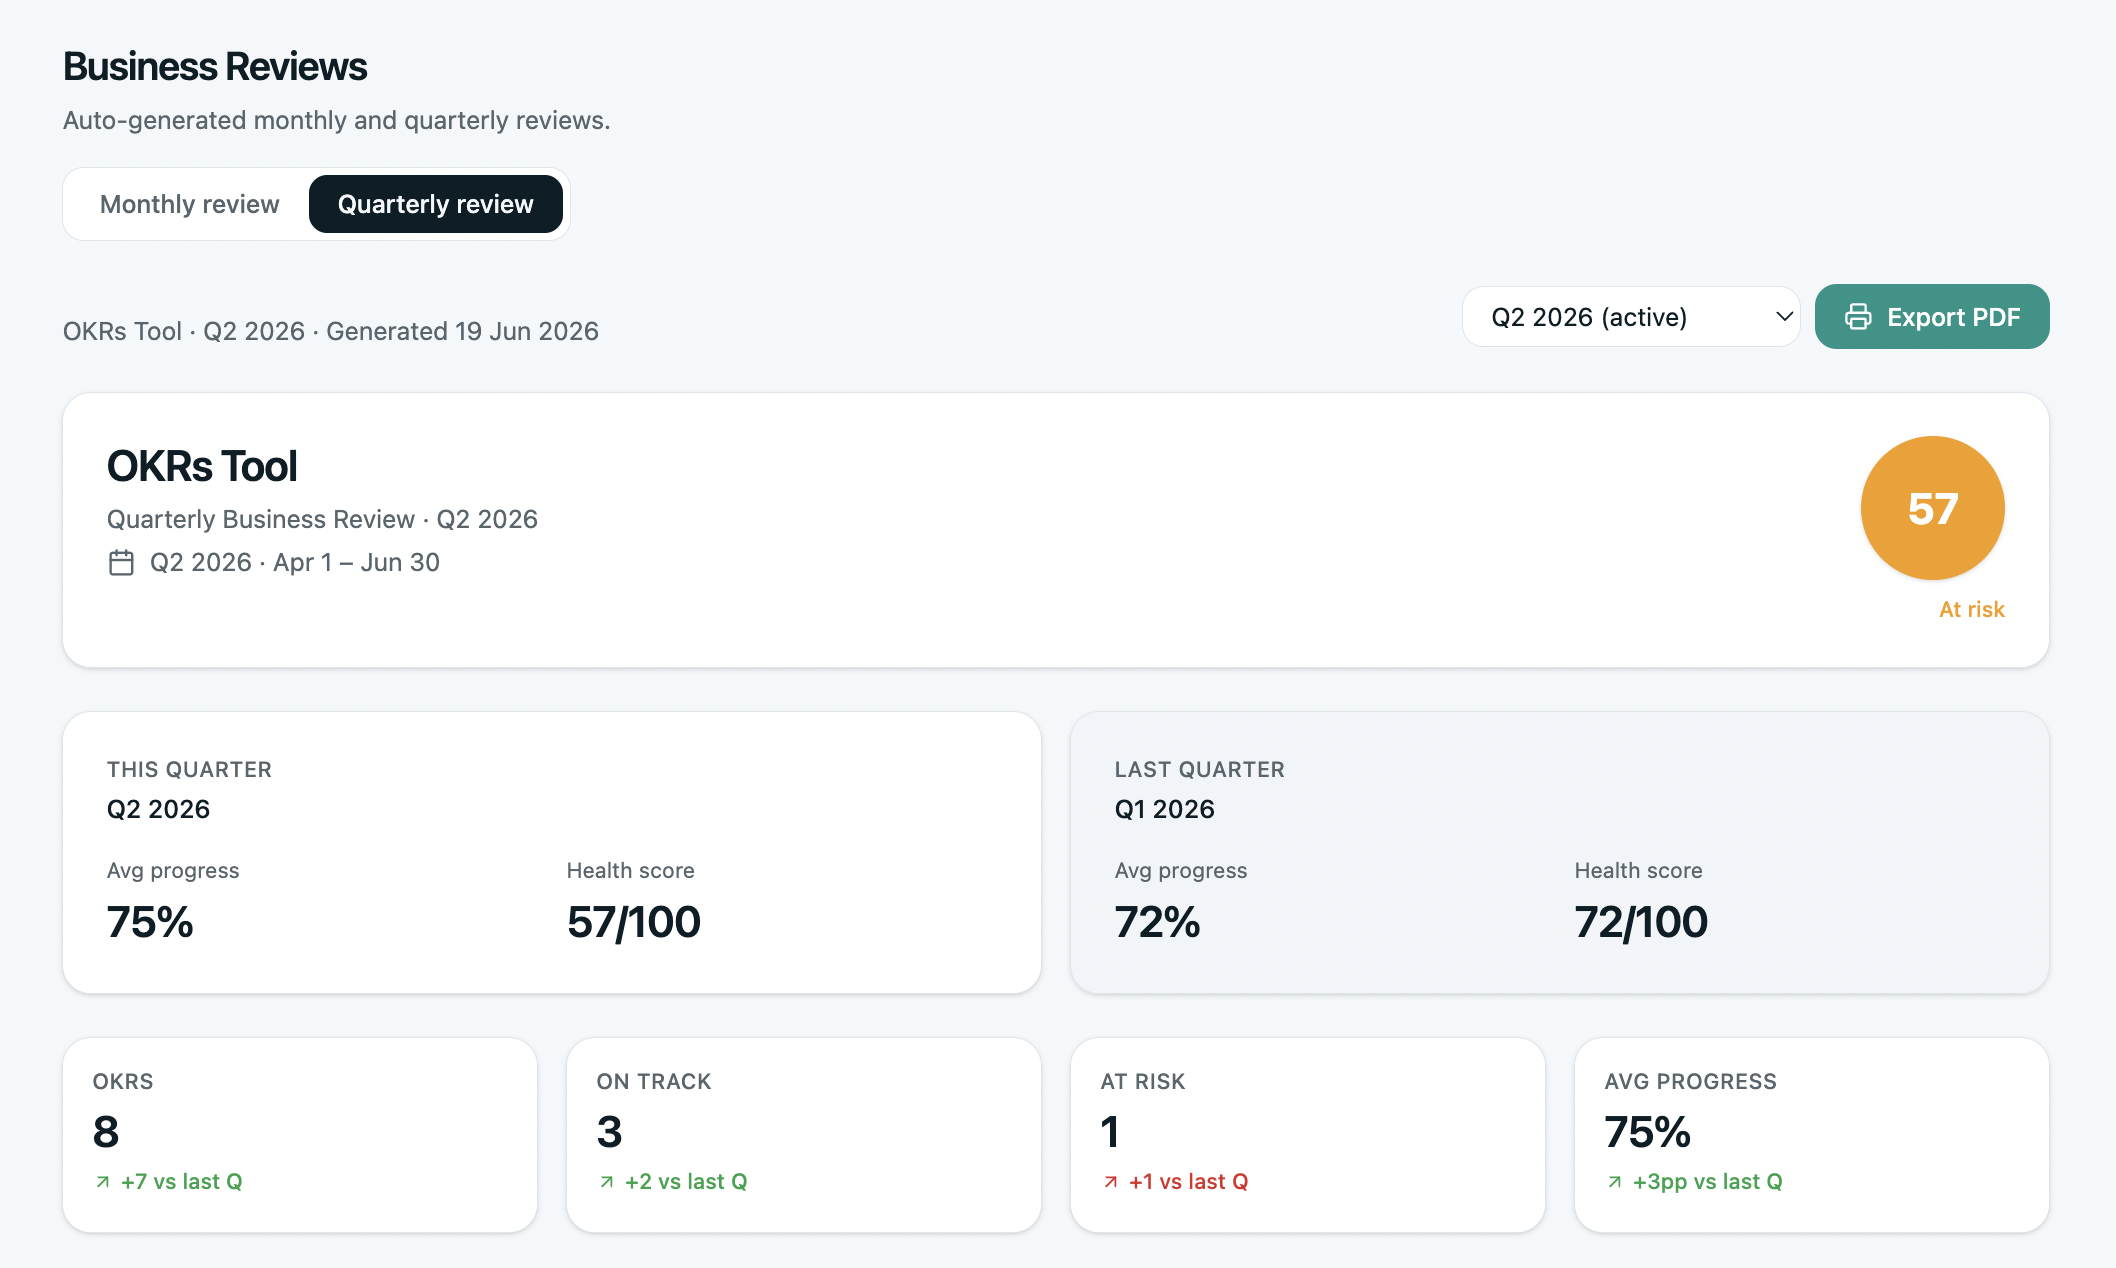
Auto-generated executive and business reviews give you a complete picture of performance without the manual assembly — health scores, average progress, at-risk flags, and quarter-on-quarter comparisons. Export to PDF and share in seconds.
- Executive briefing, MBRs, and QBRs, auto-built
- Health scores, progress, and at-risk flags
- Quarter-on-quarter comparisons
- Export to PDF, share with leadership in seconds
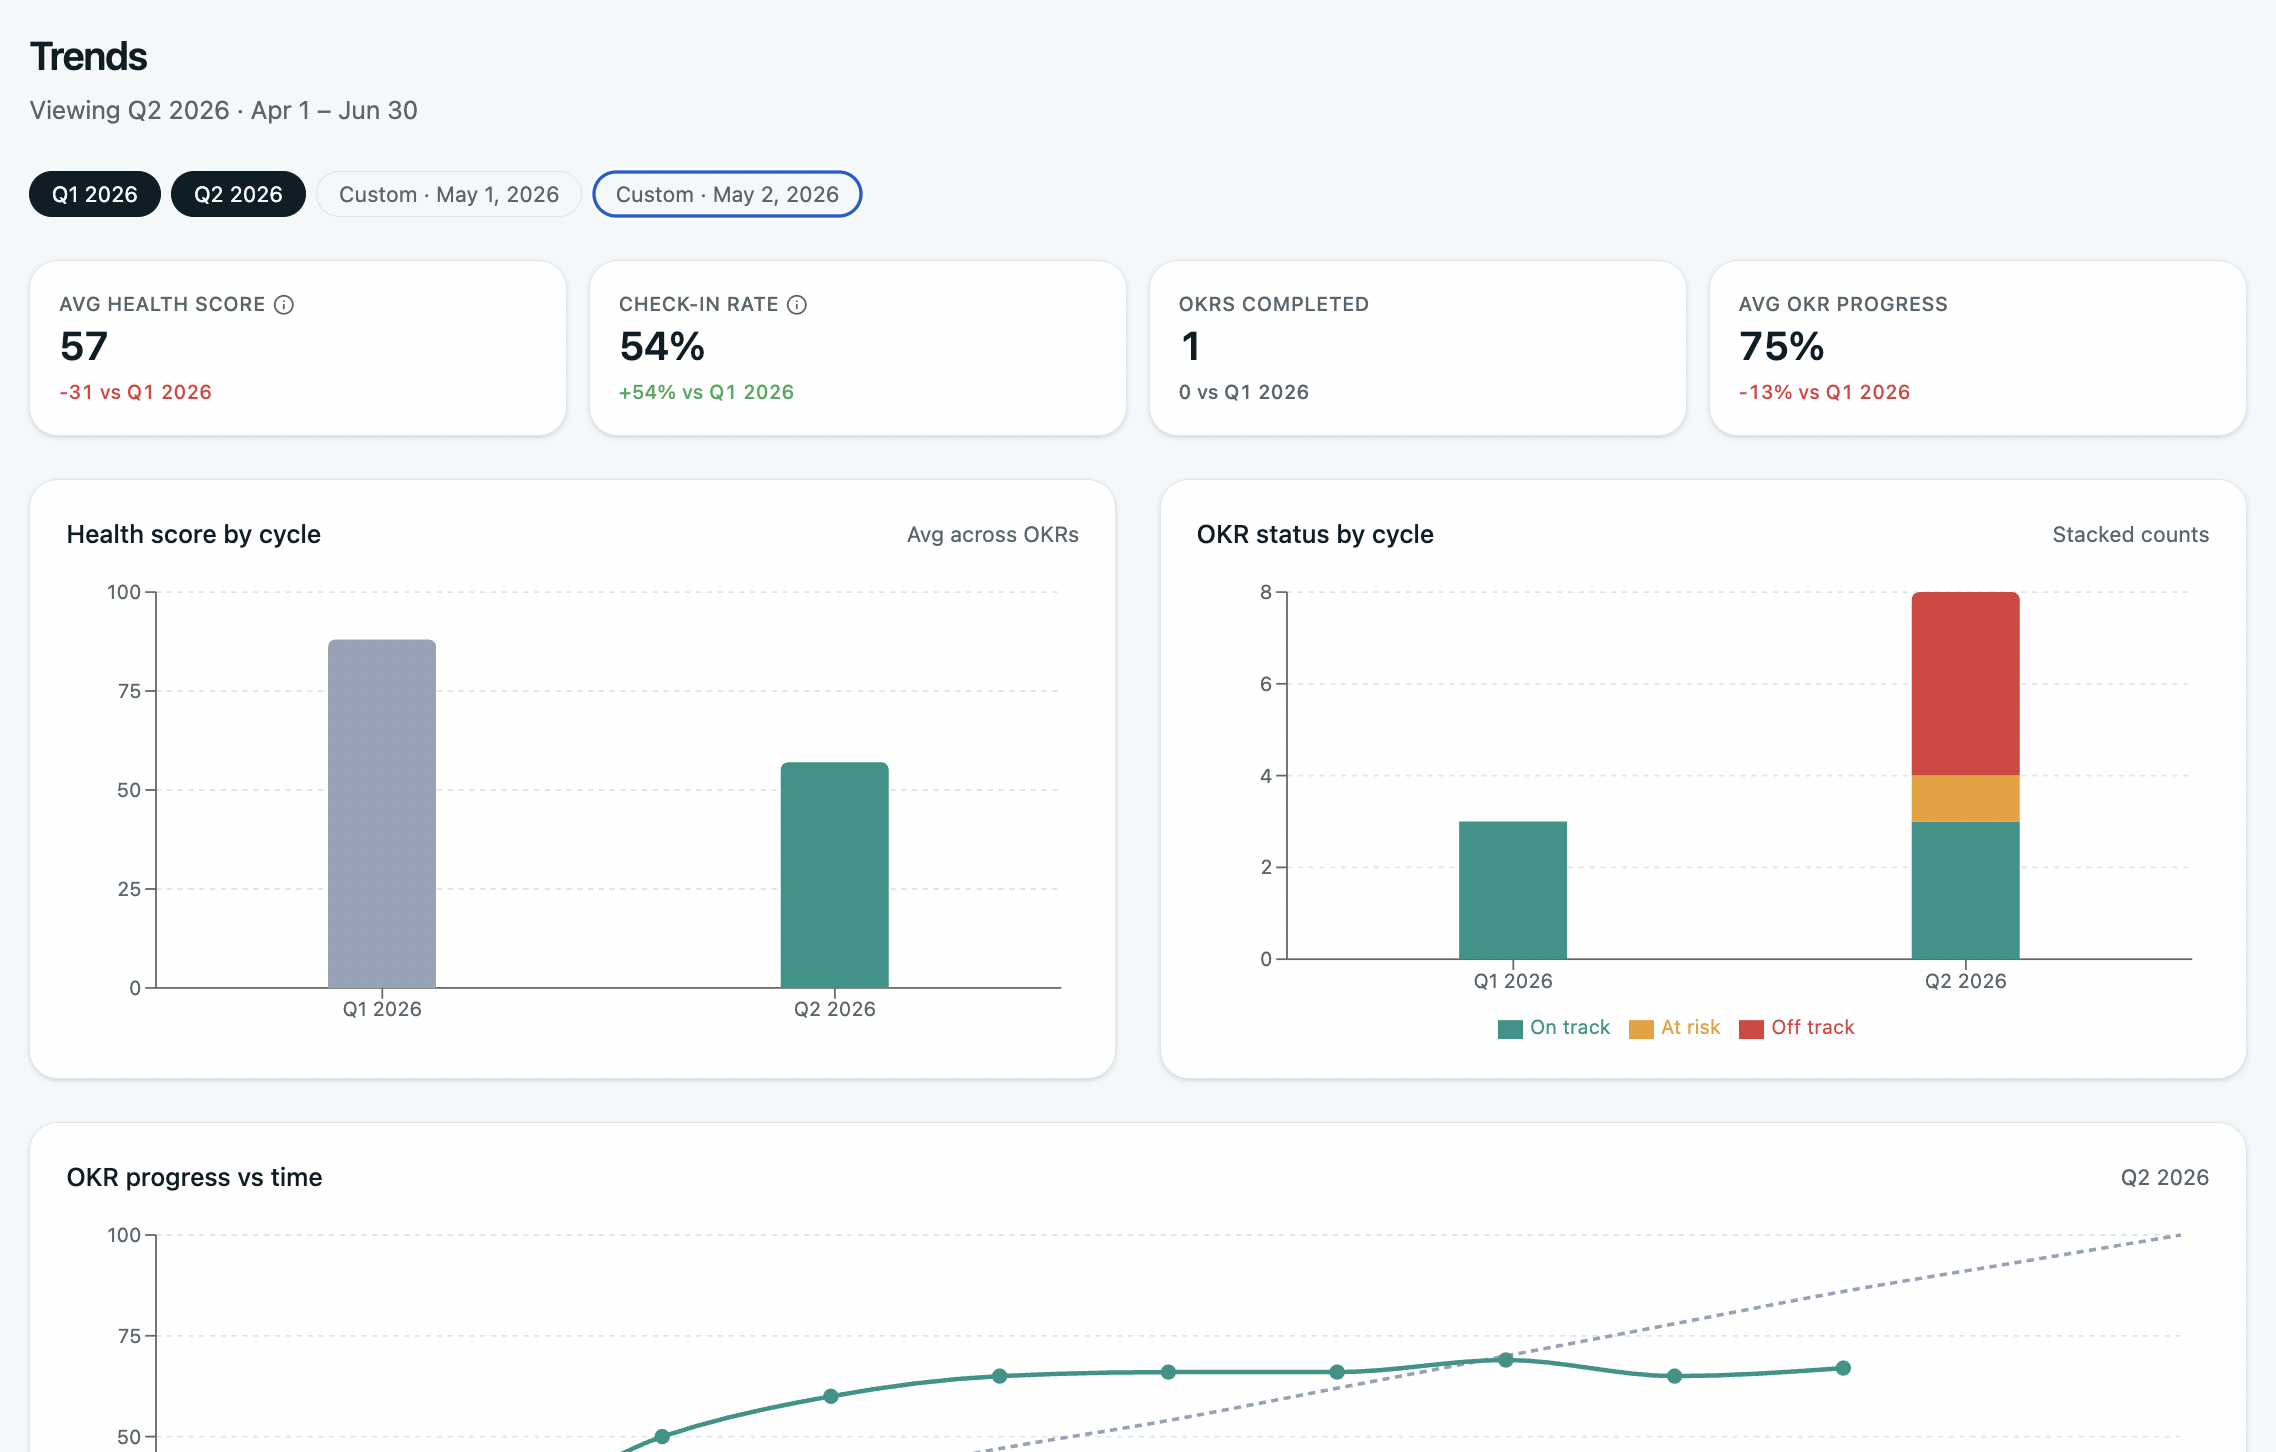
See how the whole cycle is trending.
Track progress, health, and completion as they move across the cycle — not a single snapshot. See where the trend is heading, spot the week things shifted, and compare this cycle against the ones before it.
- Progress and health trended across the cycle
- Spot the week the trend shifted
- Compare this cycle against previous ones
- Full KR history underneath, when you need it
Everything else that tells you where you stand.
The views that turn scattered progress into a picture you can act on.
Custom dashboards
Choose which widgets appear and in what order — summary stats, momentum, KPIs, team performance — so you land on what matters every time you log in.
AI Insights
A plain-language read on your cycle right on the dashboard — overall pace, what's ahead or behind, and the single action worth taking this week.
Coverage gaps
See which strategic priorities have goals behind them — and which have none — so nothing important goes unmeasured across the org.
Team overview
A department-level health view across all your teams — scores, OKR counts, activity, and last check-in dates, filtered by department and cycle.
MCP server
Pull board-ready summaries and ask about any metric in plain English from Claude, Cursor, or any MCP tool — insights without opening the app.
Activity feed
A running record of what changed across the workspace — check-ins, status changes, and updates — so nothing happens without a trace.
Walk into every review already knowing.
Benchmark your pace, forecast what's at risk, and read momentum at a glance — with every report built for you. Set up in an afternoon.