Strategy

Where strategy meets execution.

Map themes, draw timelines, cascade goals — and see exactly where strategy isn't translating into work. For CEOs, COOs, and Chiefs of Staff at 50–200 person companies who need their strategy to land beyond the kickoff slide.

Free for 1–5 users Set up in an afternoon 60% adoption guarantee
Why strategy fails

Strategy that doesn't translate is just a document.

Most strategy work breaks in the handoff between leadership and teams. Three patterns we see at scale:

1

Strategy lives in slides. OKRs live in trackers.

Leadership writes a strategy doc in March. Teams write OKRs in April. The two never meet in a single tool — so by June, nobody can tell whether the work matches the strategy that started the quarter.

2

No way to see coverage gaps.

A company priority might have zero team OKRs underneath it and nobody notices until the cycle is over. Or three teams duplicate effort against the same theme because no one had visibility into who was covering what.

3

Long-horizon work doesn't connect to quarters.

A 3-year strategic bet ladders down to 12 quarterly cycles. Without a timeline view, teams forget which cycle is supposed to deliver which milestone — and the strategy drifts a quarter at a time.

Feature 1 of 4

Strategy Canvas

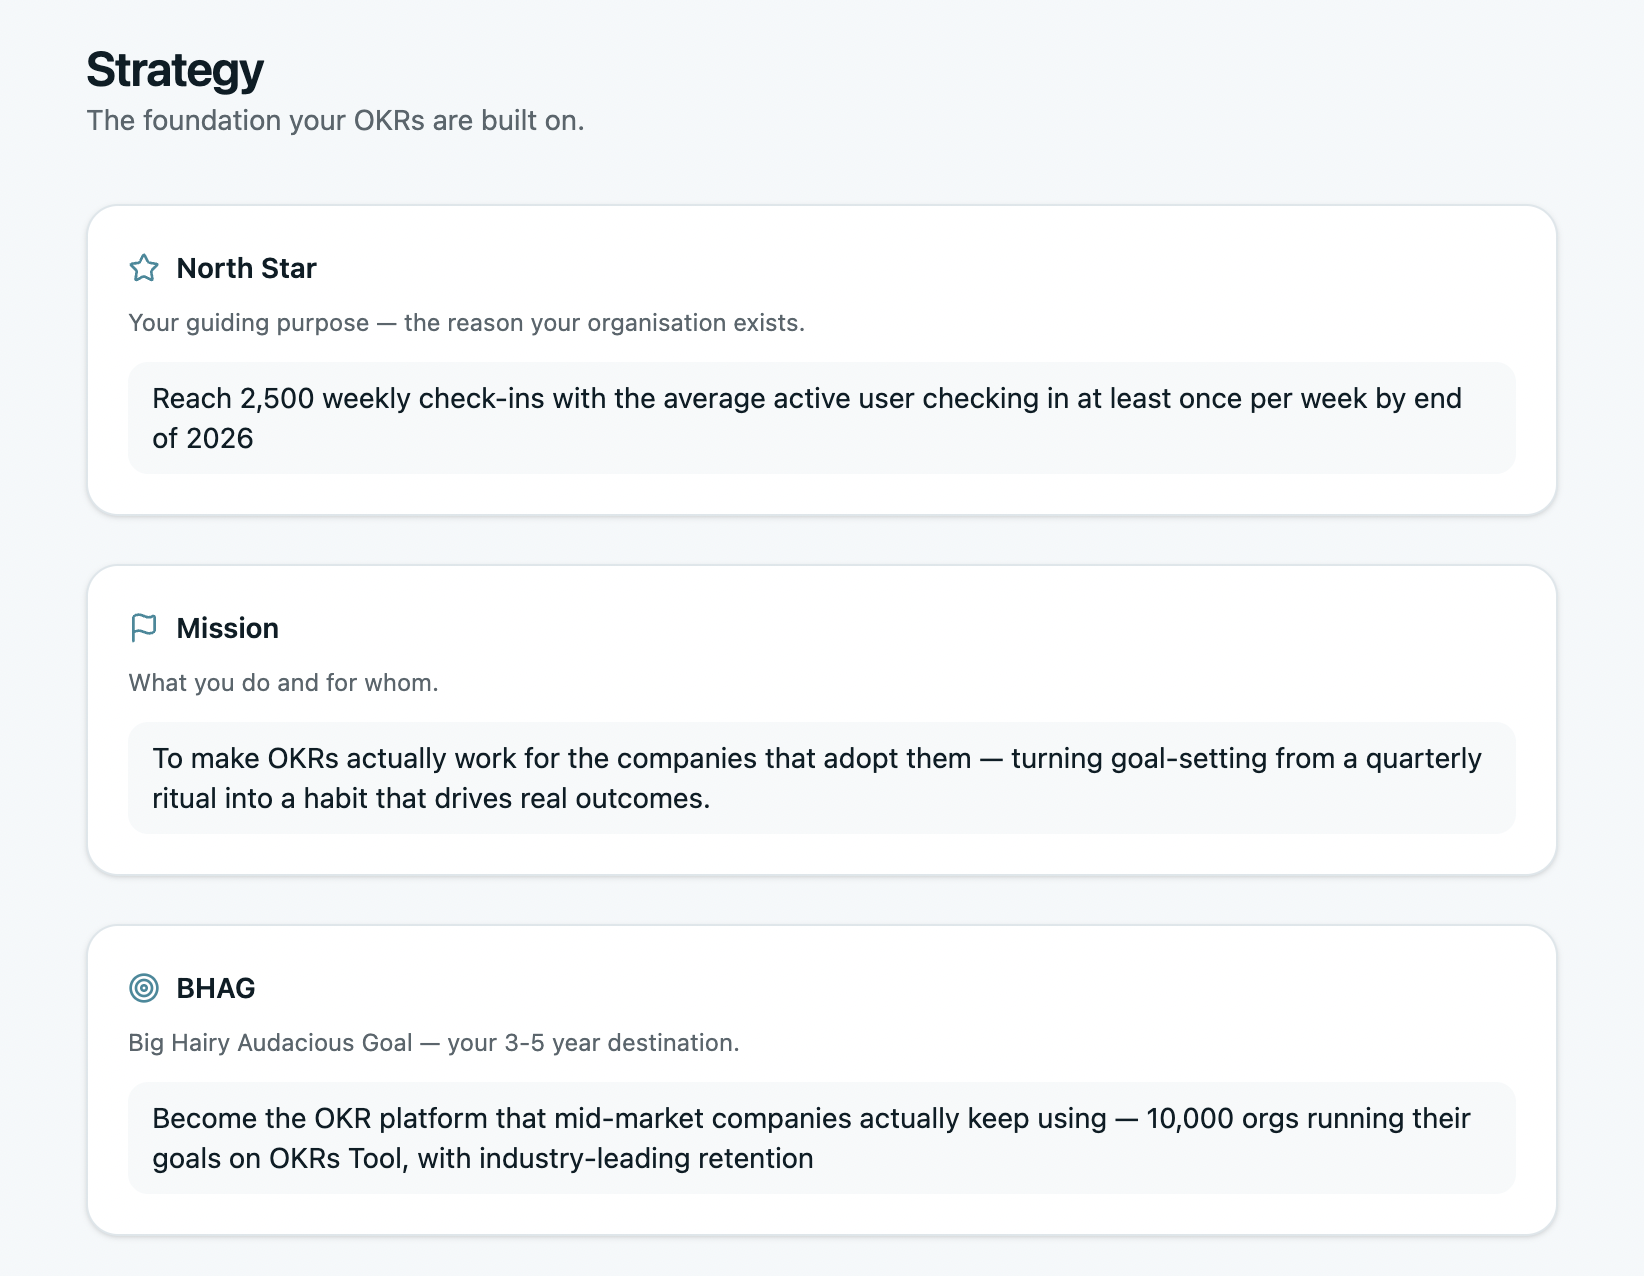
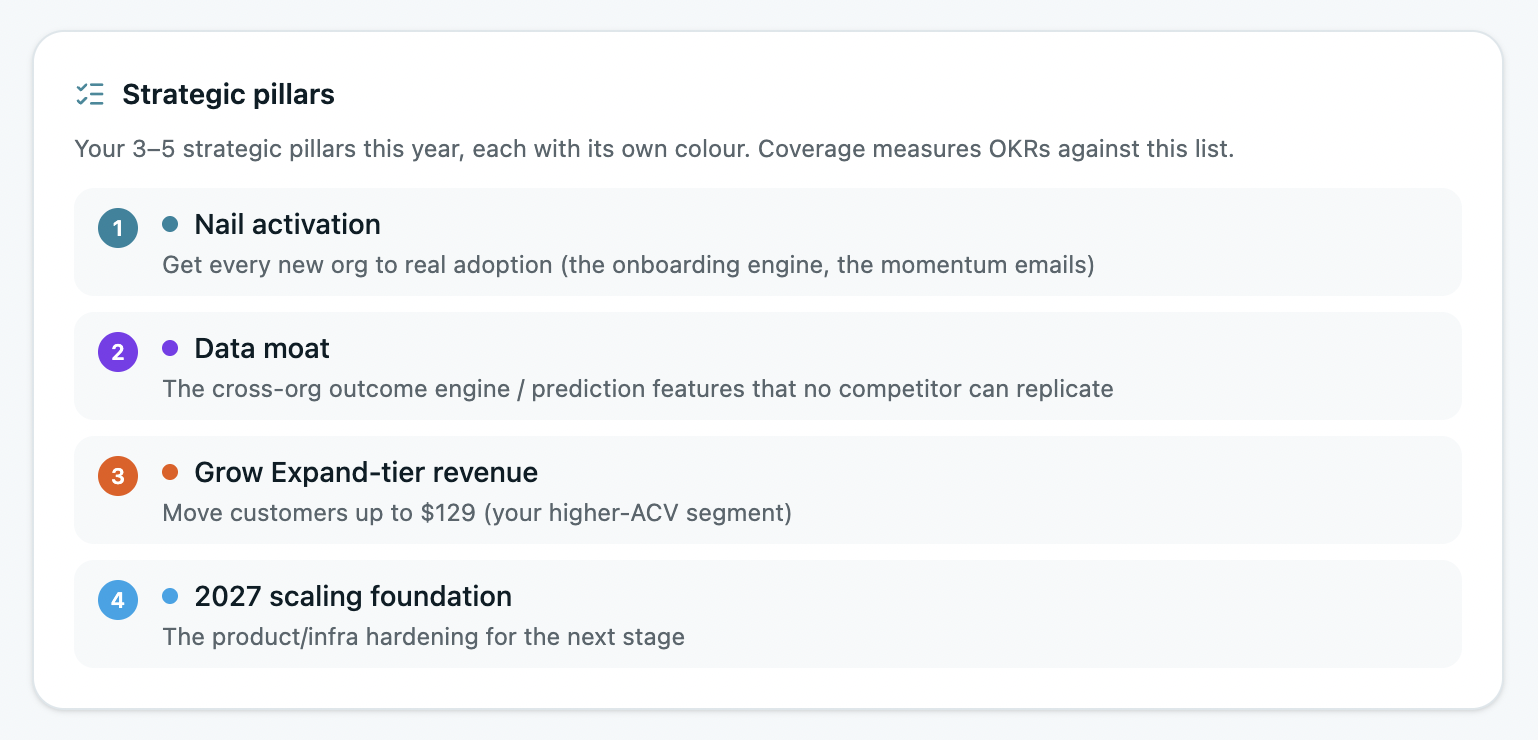
Define your strategic themes in one place — not buried in a slide deck. Vision, mission, strategy pillars, key bets — everything you committed to in your annual planning, visible to every team that needs to ladder up to it.

No more "what was the strategy again?" conversations in week 4 of the cycle. The canvas is the single source of truth that every team OKR links back to.

  • Mission, vision, and strategy themes in one structured view
  • Each theme links to the OKRs working on it
  • Visible to the whole company, editable by admins
  • Version-tracked — see what changed cycle to cycle
Strategy Canvas: themes, key bets, mission, and vision in one view
Strategy Canvas: themes, key bets, mission and vision in one view
Feature 2 of 4

Strategy Timeline

A horizontal roadmap of your strategy across multiple quarters or years. See which strategic themes are due to deliver in which cycle, who owns each milestone, and where the cycle-by-cycle handoffs are.

Turns a 3-year strategy from an abstract direction into a sequenced plan — with the OKRs and KRs that deliver each step visible underneath.

  • Multi-quarter view — map strategy across 4, 8, or 12 cycles
  • See which OKRs deliver which milestones
  • Highlight strategic gaps between commitments and OKR coverage
  • Export to PDF for board presentations
Strategy Timeline: multi-cycle roadmap of themes and milestones
Strategy Timeline: themes and milestones mapped across multiple cycles
Feature 3 of 4 · Unique to OKRs Tool

Strategy Coverage diagnostic

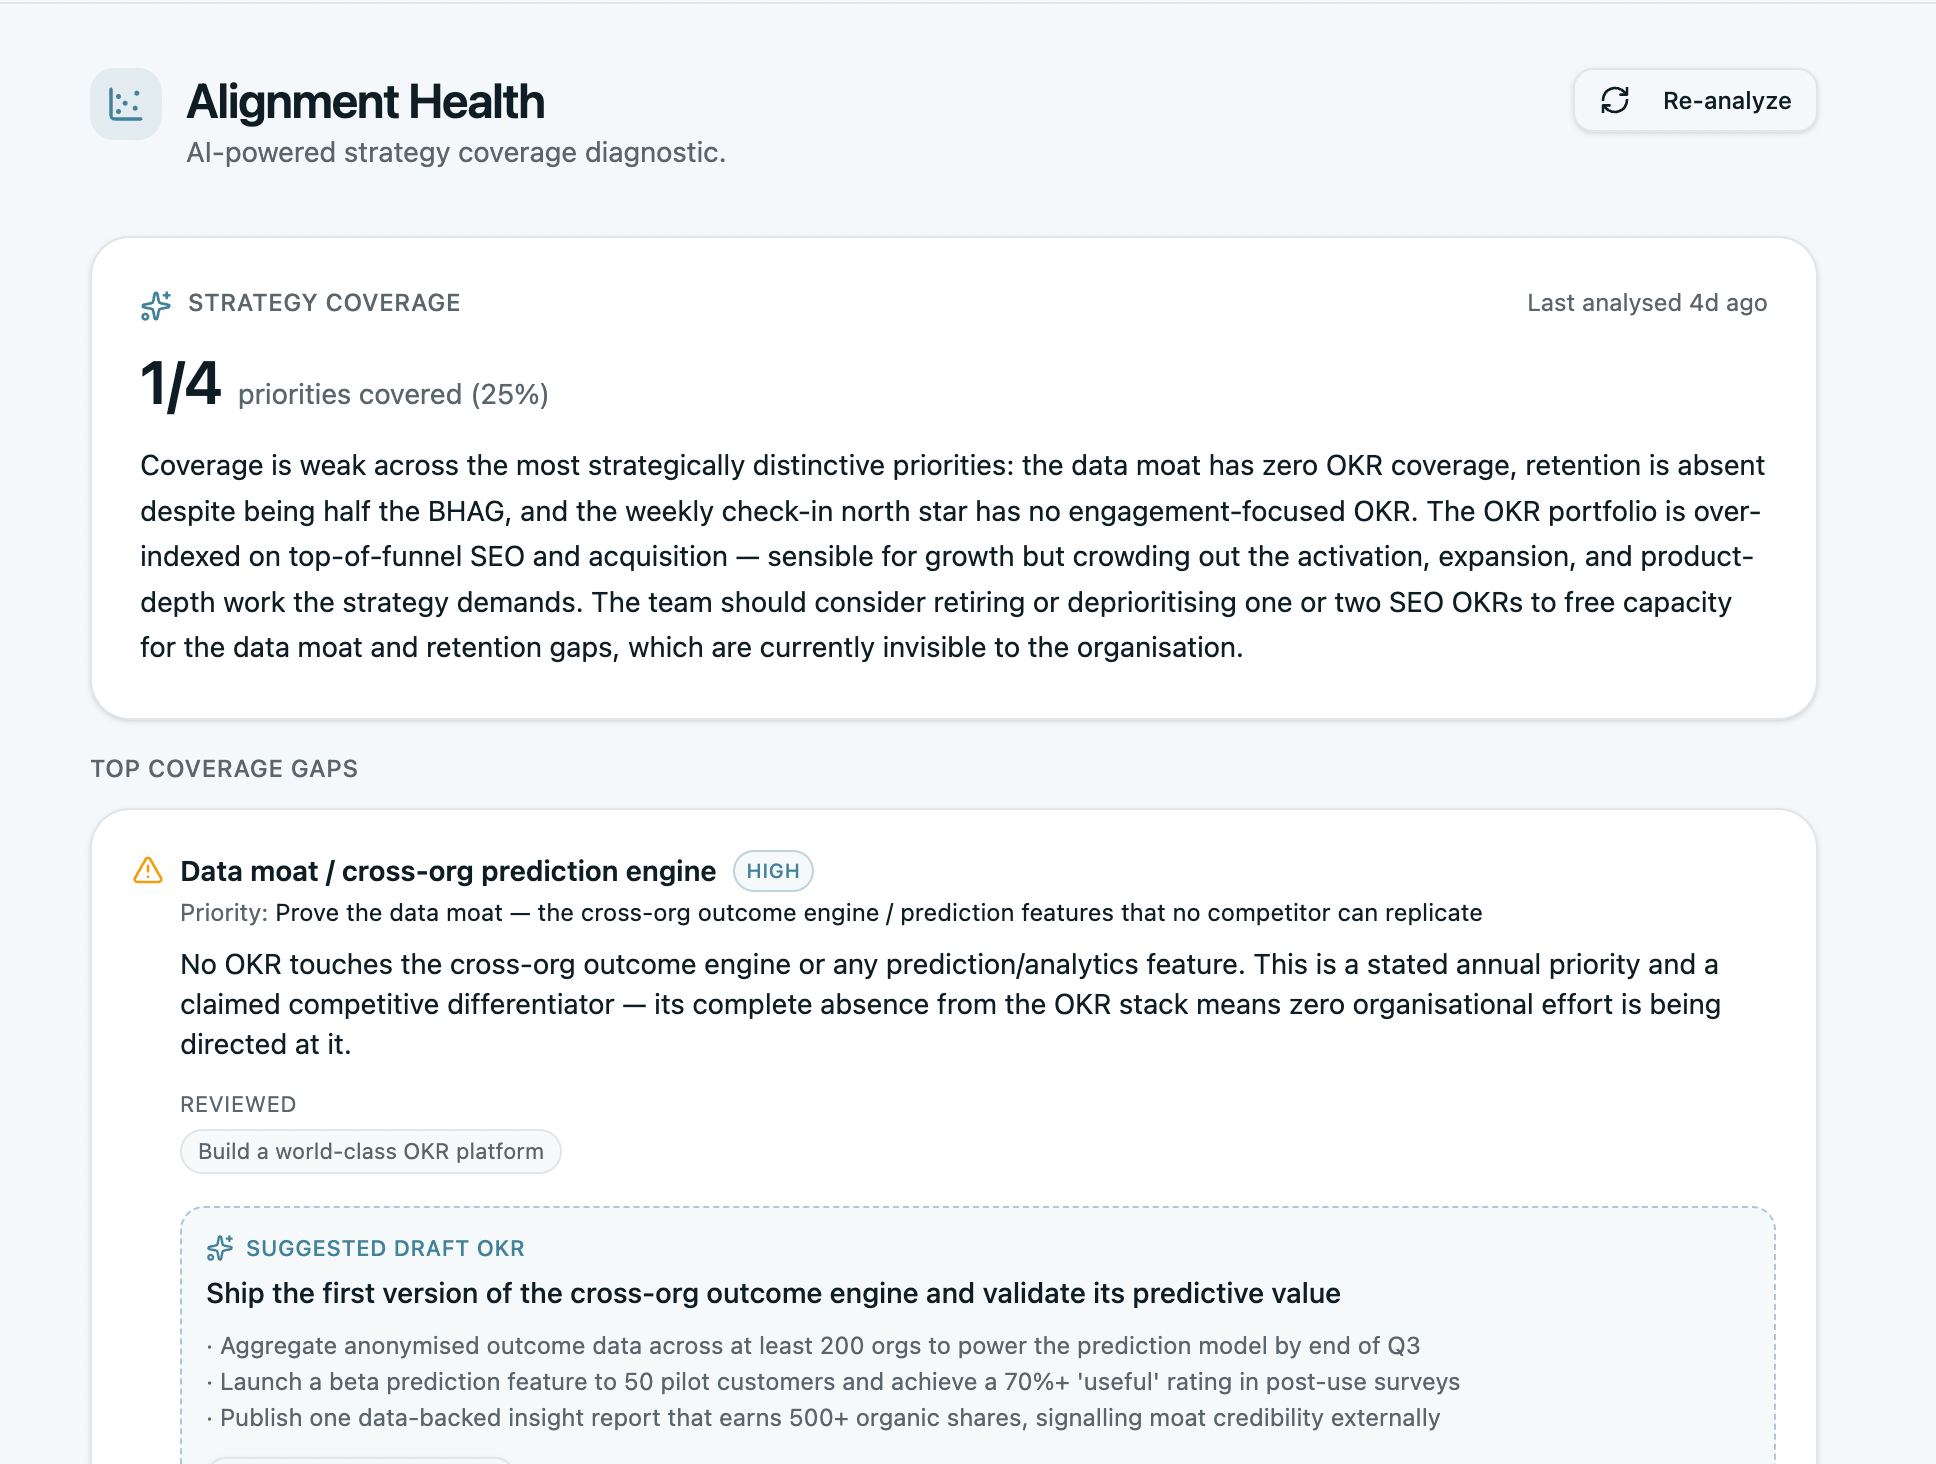
Map your strategic themes against the OKRs your teams are actually working on. Spot the gaps — the priorities with no team OKRs underneath them — before the quarter starts, not at the end.

Strategy that doesn't translate into OKRs is just a document. Strategy Coverage shows you where the translation broke, theme by theme, before you commit a cycle's worth of work to the wrong things.

  • Surfaces strategic themes with zero KR coverage — the silent gaps
  • Flags themes with too many overlapping KRs — duplicated effort
  • Shows coverage strength by team — who's pulling their weight
  • Run before kickoff, fix on the spot
Strategy Coverage diagnostic
Strategy Coverage maps themes against assigned KRs
Feature 4 of 4

Cascade Map

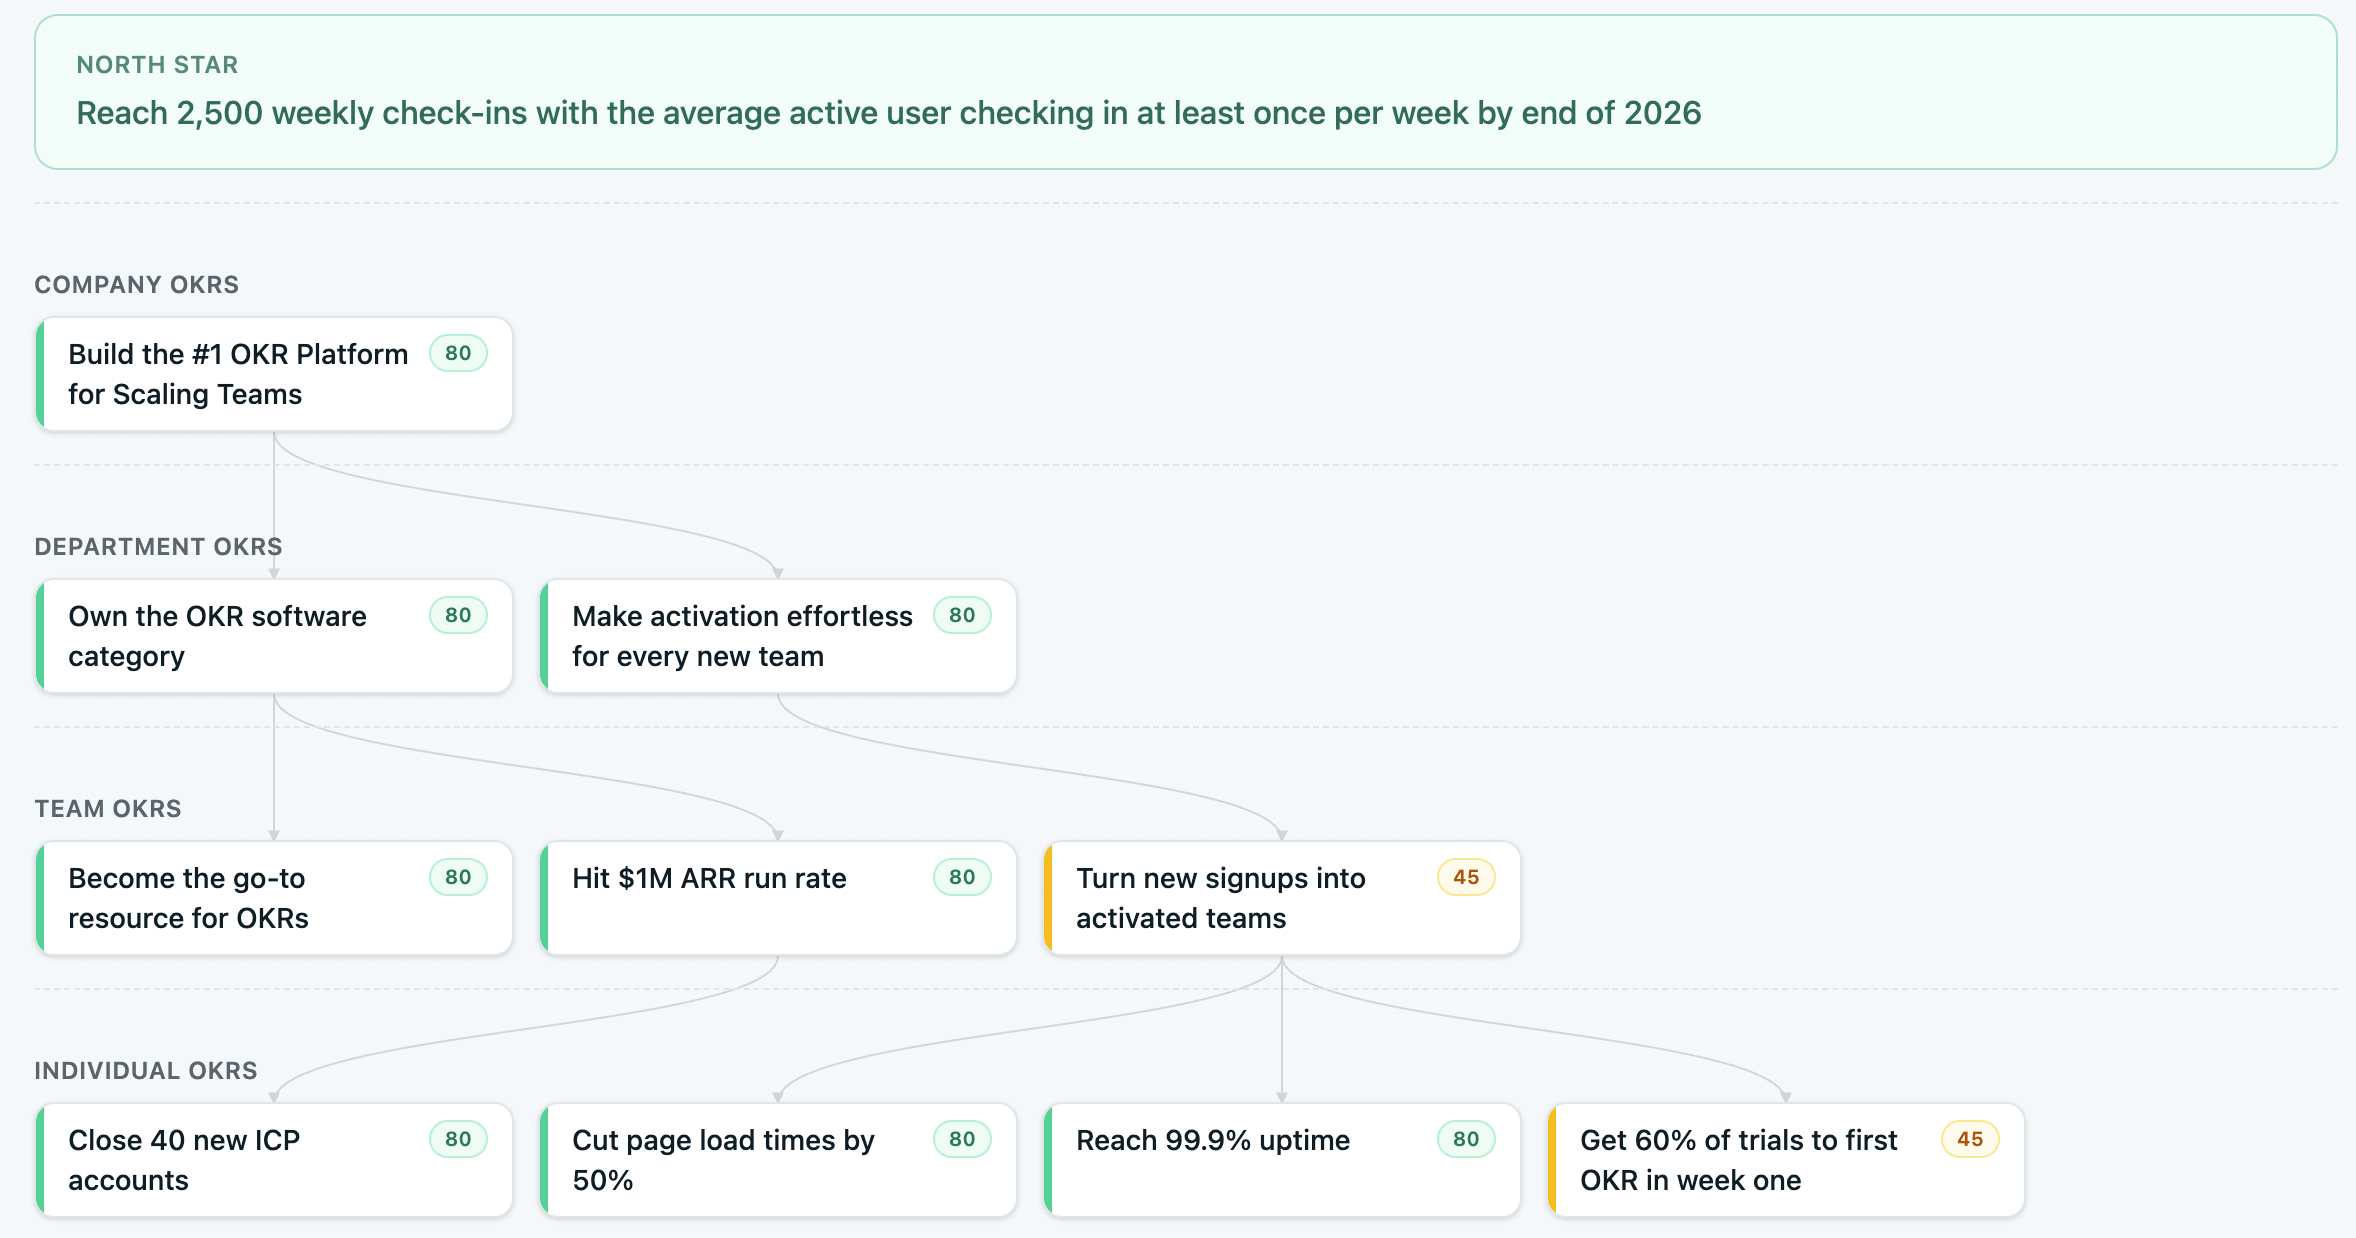
A top-down visual of how strategy flows from company OKRs down to team and individual KRs. See exactly how each goal contributes to a parent priority — and spot the orphans that don't connect to anything.

When the CEO asks “how does what your team is doing ladder up to our company goal?”, the cascade map answers the question in one click. No more reconstructing the connection from memory.

  • Top-down view: company → department → team → individual
  • Lines show how each goal connects to its parent
  • Surface orphan goals that don't cascade up to anything
  • Click any node to drill into its KRs and progress
Cascade Map: top-down view of how strategy flows to team OKRs
Cascade Map: top-down view of how goals connect to a parent priority
Unique to OKRs Tool

The weekly read that writes itself.

Every Monday morning, admins get an AI-generated briefing of what happened last week — OKR movements, completed initiatives, KRs hitting target, and the risks worth leadership attention. Ready before your week starts.

The Weekly Briefing

Every Monday, the AI runs through what shipped, what moved, and what slipped — across every strategic theme, every team OKR, every KR. Wins, movement, and what needs attention — structured for the way leadership actually reads.

No more “I'll write the update Sunday night.The briefing is waiting in your inbox — share it, reference it in your leadership update, or use it as the agenda for your Monday standup.

  • Auto-generated every Monday morning — before your week starts
  • Wins, movement, and risks — organized for leadership
  • Covers OKR progress, completed initiatives, and at-risk KRs
  • Customizable structure — choose which signals matter most
  • The Monday ritual that replaces the Sunday-night update
Weekly Briefing: AI-generated Monday recap of what shipped, moved, and slipped
Weekly Briefing · delivered every Monday morning
Customer story

OKRs Tool helped us create a much stronger connection between strategy, execution, and measurable outcomes. What previously lived across different platforms is now centralized and gives leadership a consistent view of priorities and progress.

Alberto Santini, Tinaba
Alberto Santini
General Manager, Tinaba
Frequently asked

Strategy questions, answered.

Four questions ops leaders and Chiefs of Staff ask before rolling out OKRs Tool for strategy.

Do I need a strategy document before I start?
No. Most teams build the strategy canvas inside OKRs Tool itself — mission, vision, themes, key bets — as they set up their first cycle. You can also import an existing strategy doc (paste text, upload PDF, or use AI to extract themes).
Can different departments use different cycle lengths?
Yes. Company cycle is usually quarterly, but engineering might run 6-week cycles, sales might run monthly, customer success might run yearly. Every team picks its own cadence; the cascade map and timeline show them all together.
How does Strategy Coverage handle qualitative themes?
Each strategic theme can be tagged with the OKRs that support it — whether those KRs are quantitative (e.g., revenue), qualitative (e.g., culture), or binary (e.g., shipped/not shipped). Coverage is measured by how many KRs ladder up to a theme, not whether the KRs are numeric.
Can I share the strategy view with my board?
Yes. Three options: secure read-only link (no signup required for viewers), PDF export for slide decks, or screenshot the live view straight into your board pre-read. Boards tend to prefer the live link — they can drill into any OKR they want to question.
Related sections

Strategy is one of five sections.

Each is included on every plan. Click any to see the views inside.