OKRs Tool's analysis of 7,857 Key Results found 52% were KPIs or tasks in disguise — metrics teams already track continuously rather than outcomes they're deliberately trying to change. The OKR vs KPI distinction isn't just a terminology problem. It's the most common failure mode in goal-setting, and it's hiding in the goals themselves.
The confusion between OKRs and KPIs is understandable. Both involve metrics. Both involve measurement. Both get presented in the same quarterly planning session. But they're built for fundamentally different purposes, and conflating them produces goals that look rigorous while measuring nothing that's actually being changed.
The most common symptom: a Key Result that reads "maintain monthly churn below 4%." Churn is a critical metric. It absolutely belongs on a dashboard. But it's a KPI — a continuous health indicator that gets tracked every week regardless of whether there's an OKR cycle running. Writing it as a Key Result doesn't make it an OKR. It makes it a KPI wearing an OKR's name. The team monitors it. Nobody is working to change it. The goal is decorative.
What Is a KPI?
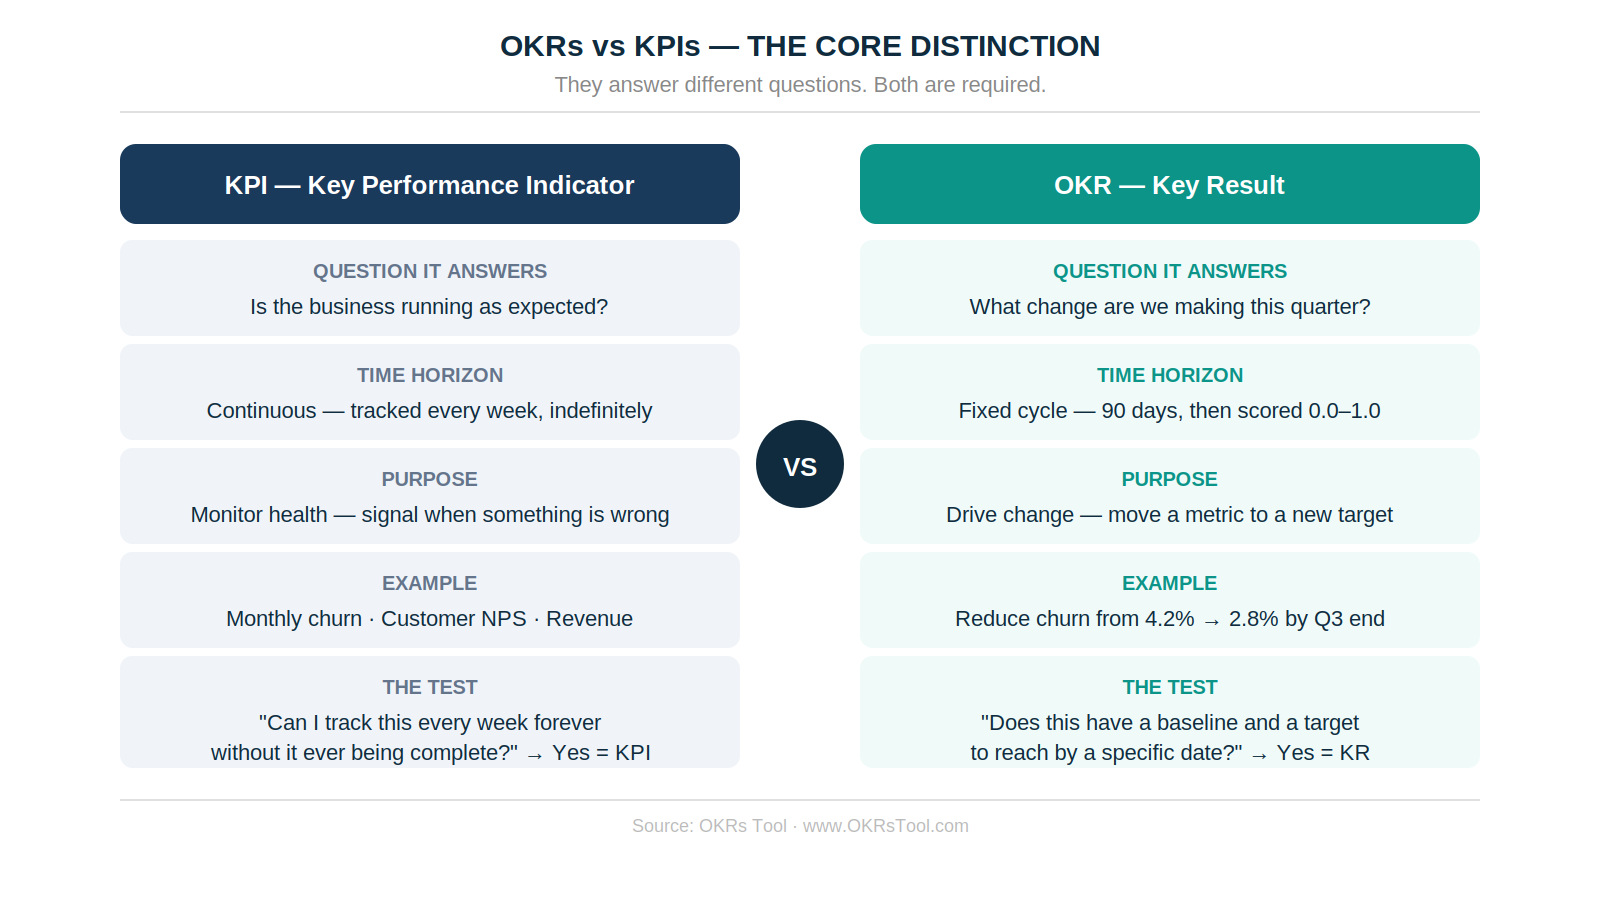
A KPI (Key Performance Indicator) is a metric that monitors the ongoing health of a function, process, or business outcome. KPIs don't have a start date and an end date. They're tracked continuously — every week, every month, indefinitely — and they signal whether things are running as expected.
Monthly churn rate, customer NPS, revenue, conversion rate, uptime — these are KPIs. They're not project-specific goals. They're the instruments on the dashboard that tell you whether the business is healthy. When a KPI moves unexpectedly — churn spikes, NPS drops — something needs attention. When it's stable and within range, it's doing its job.
The test for a KPI: "Can I track this metric every week forever, without it ever being complete?" If yes — it's a KPI. It belongs on the dashboard. It should inform the OKR planning process. It should not be a Key Result.
What Is an OKR?
An OKR is a goal-setting framework that defines the deliberate change a team is working to create in a specific time period. It has two components: an Objective — a qualitative statement of direction — and two to four Key Results — specific, measurable outcomes that prove the Objective was achieved.
OKRs are time-bound. They belong to a quarterly cycle that starts, runs for 90 days, gets scored honestly at the end, and informs the next cycle through a retrospective. When the cycle ends, the OKR is complete — scored 0.0–1.0 per Key Result. A Key Result that would just keep running if nobody closed the cycle is a KPI, not a Key Result.
The test for a Key Result: "Does this have a baseline and a specific target to reach by a specific date?" If yes — it's a Key Result candidate. "Reduce churn from 4.2% to 2.8% by end of Q3" has both. "Maintain monthly churn below 4%" has neither.
Why 52% of Key Results Are KPIs in Disguise
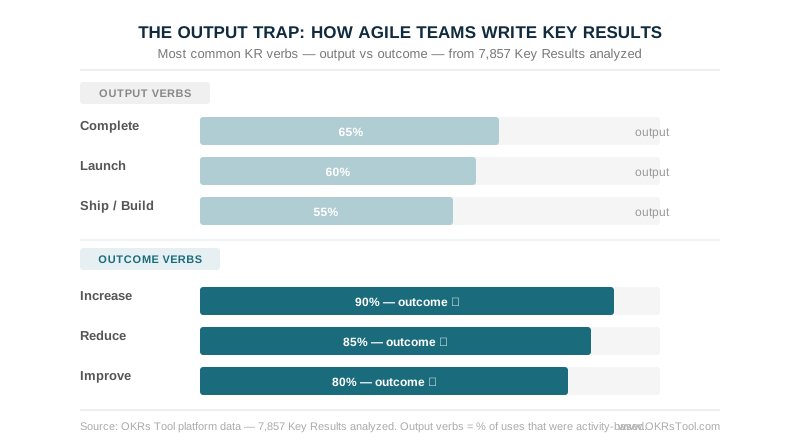
OKRs Tool's analysis of 7,857 Key Results written by real teams found that 52% were KPIs or tasks in disguise — continuous metrics or activity descriptions rather than genuine outcome measures. The most common offending verbs: Complete, Maintain, Conduct, Track, Launch. These describe either work (tasks) or ongoing monitoring (KPIs). Neither describes the business change that the OKR framework is designed to create.
The failure mode is consistent: teams take the KPIs they already track on their dashboard — revenue, churn, conversion rate, NPS — and write them into the Key Results column without adding a baseline, a target, or a cycle boundary. The metric appears in both places. The team monitors it in both places. Nobody is working to change it in either place. The goal management system becomes a second dashboard rather than an execution mechanism.
The fix is the baseline-to-target format: Improve [business outcome] from [baseline] to [target] by [end of quarter]. This format is impossible to complete with a KPI that has no target, and impossible to write without knowing what the current state is — which forces the diagnostic work that good OKR writing requires.
The Full Comparison
How KPIs and OKRs Work Together
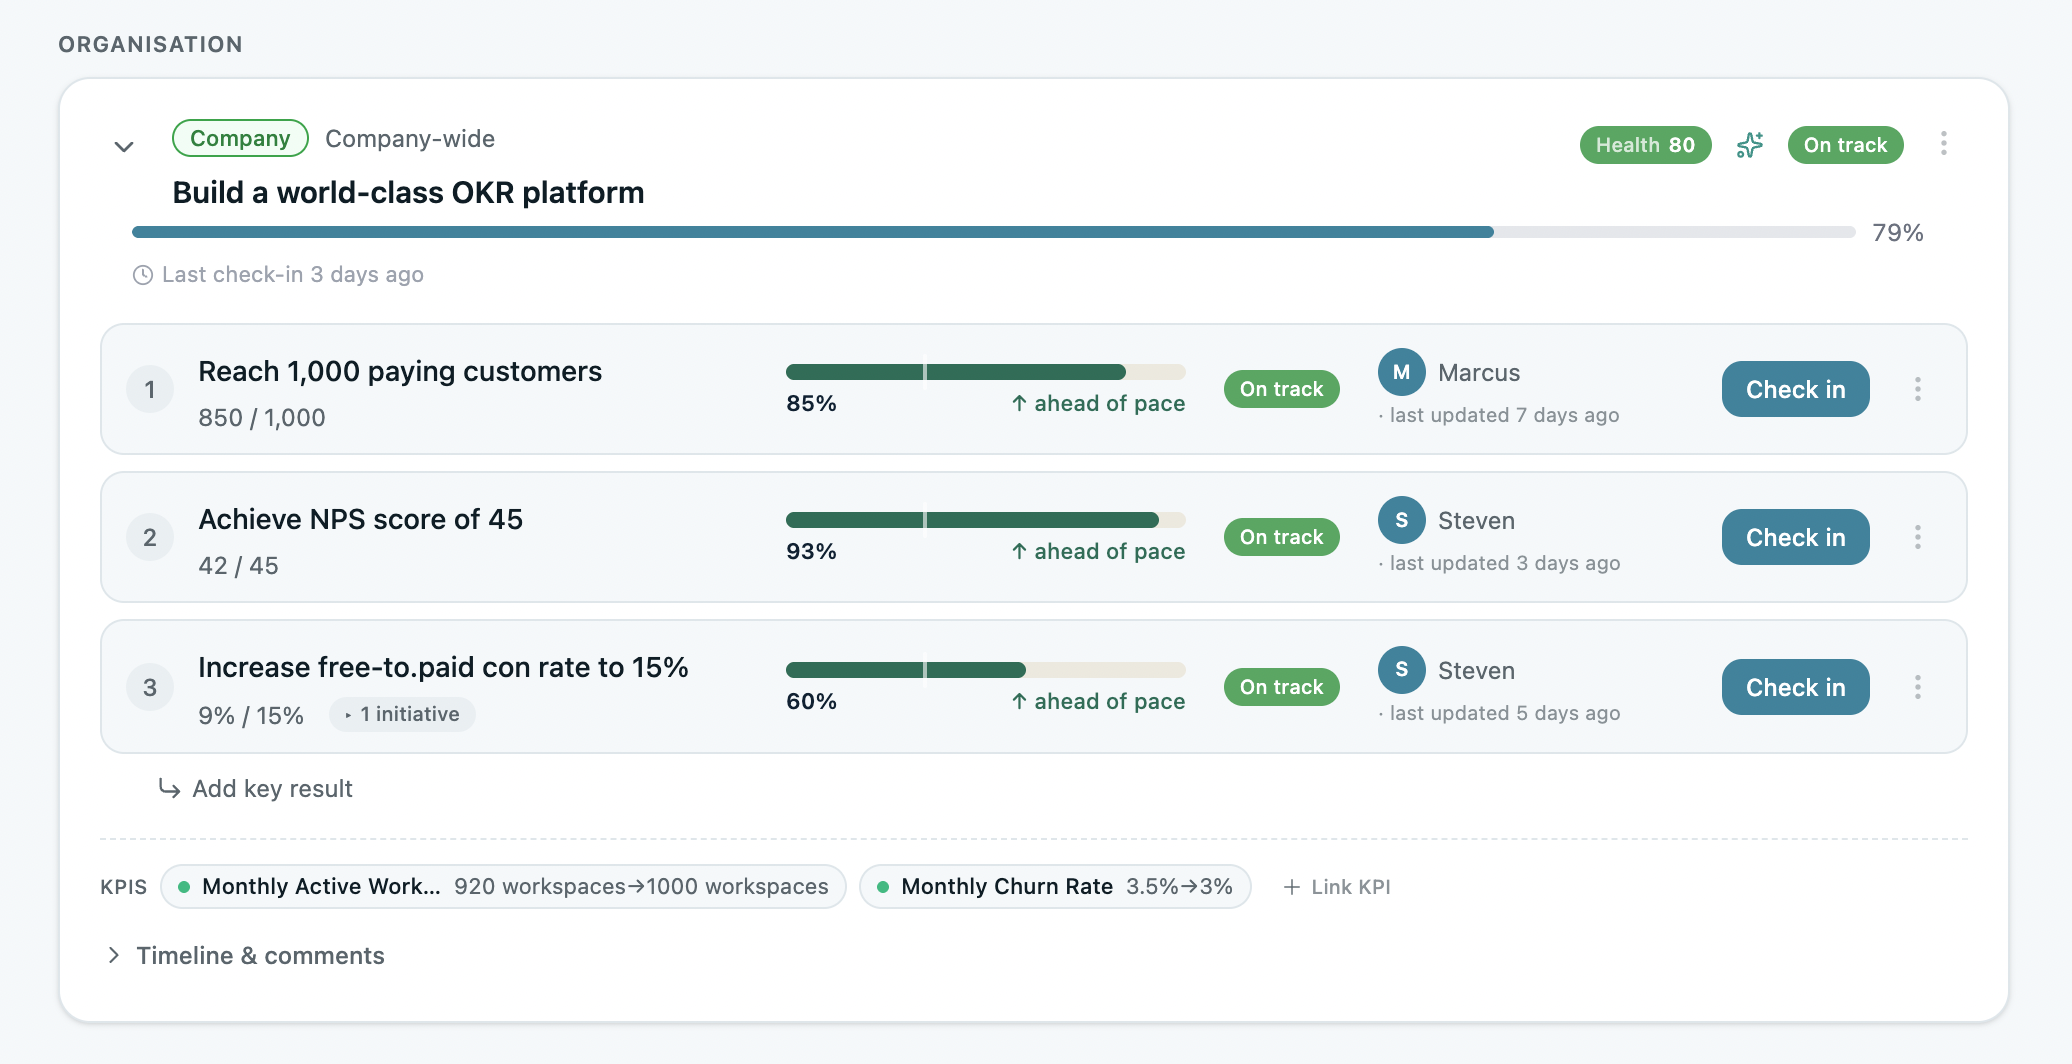
The relationship between KPIs and OKRs is directional: KPIs identify which metrics need to change, and OKRs define the quarterly plan for changing them. A KPI that's out of range is the trigger for an OKR. The OKR's Key Result is a time-bound version of that KPI — with a specific target and a named owner working to move it.
When churn is rising, the KPI is the signal. The OKR is the response: "Reduce churn from 4.2% to 2.5% by end of Q3 — owned by the Head of Customer Success." The KPI continues to be monitored on the dashboard. The OKR defines the quarterly execution plan for moving it. When the cycle ends and the Key Result is scored, the KPI reflects the result.
Teams that run this loop well use their KPI dashboard as the input to OKR planning — identifying which health metrics need deliberate intervention this quarter — and use their OKR system to drive the change. Teams that conflate the two end up with goals that monitor the dashboard rather than move it.
The Three Most Common Mistakes
Writing KPIs as Key Results. "Maintain monthly churn below 4%" is a KPI with a target range, not a Key Result with a baseline and a destination. It belongs on the dashboard. Putting it in the OKR system doesn't give it an owner or a plan — it just gives it a second home where nobody is actively working to change it.
Writing tasks as Key Results. "Launch new onboarding flow" is an initiative — the specific work that might move a metric. The Key Result is the metric it's trying to move: "Increase Day 7 activation from 34% to 55%." Our analysis of 7,857 Key Results found the most common underperforming verb was "Complete" — 100 instances of a task description dressed up as an outcome measure.
Running OKRs without KPIs as the baseline. OKR planning sessions that start from a blank page rather than a KPI dashboard produce goals disconnected from the actual state of the business. The KPI dashboard is the diagnostic that tells you which metrics are out of range and most need deliberate intervention this quarter. Without it, OKRs are aspirational rather than diagnostic.
OKRs and KPIs: What High-Performing Teams Do Differently
The 2026 OKR Benchmark Report found teams that check in weekly complete 43% more OKRs than those reviewing monthly or ad hoc. That lift comes from the OKR system — the weekly check-in, the named owner, the retrospective at cycle end. But the KPI system is what tells teams which metric is worth a quarter of focused effort. Neither produces results alone.
The organizations generating 1:88 return on investment from OKRs Tool use their KPI dashboard as the input to OKR planning every quarter — identifying the two or three metrics most in need of deliberate intervention — and use the OKR cycle to drive the change. The KPI tells them what needs to move. The OKR defines how they're going to move it and what success looks like in 90 days.
OKRs vs KPIs: Use Both, Conflate Neither
KPIs and OKRs are complementary instruments. KPIs keep the dashboard honest — they surface which metrics are healthy and which need attention. OKRs translate that attention into a quarterly execution plan with named ownership, weekly visibility, and an honest score at cycle end. Use KPIs to monitor. Use OKRs to move. See how OKRs Tool tracks both in a single workflow — free for up to 5 users.
Data: OKRs Tool platform data (7,857 Key Results analyzed), The 2026 OKR Benchmark Report (330 organizations).