
The Balanced Scorecard tells you whether your strategy is working. OKRs create accountability for changing specific outcomes this quarter. Most growing teams need the execution layer first.
Robert Kaplan and David Norton developed the Balanced Scorecard in 1992 to solve a real problem: large enterprises were managing by financial results alone, and by the time the numbers looked bad, the underlying problems had been building for years. The BSC added three non-financial perspectives — Customer, Internal Processes, and Learning & Growth — giving executives an earlier warning system across all four dimensions of organizational health.
It was a significant advance in strategic measurement. It was also built for organizations with established strategy functions, annual planning cycles, and the management bandwidth to track performance across four distinct perspectives. Kaplan and Norton's original case studies were companies like Mobil, AT&T, and Cigna — not 60-person SaaS companies in their third OKR cycle.
That context matters when deciding whether the BSC or OKRs is the right framework for your stage.
What the Balanced Scorecard Actually Does
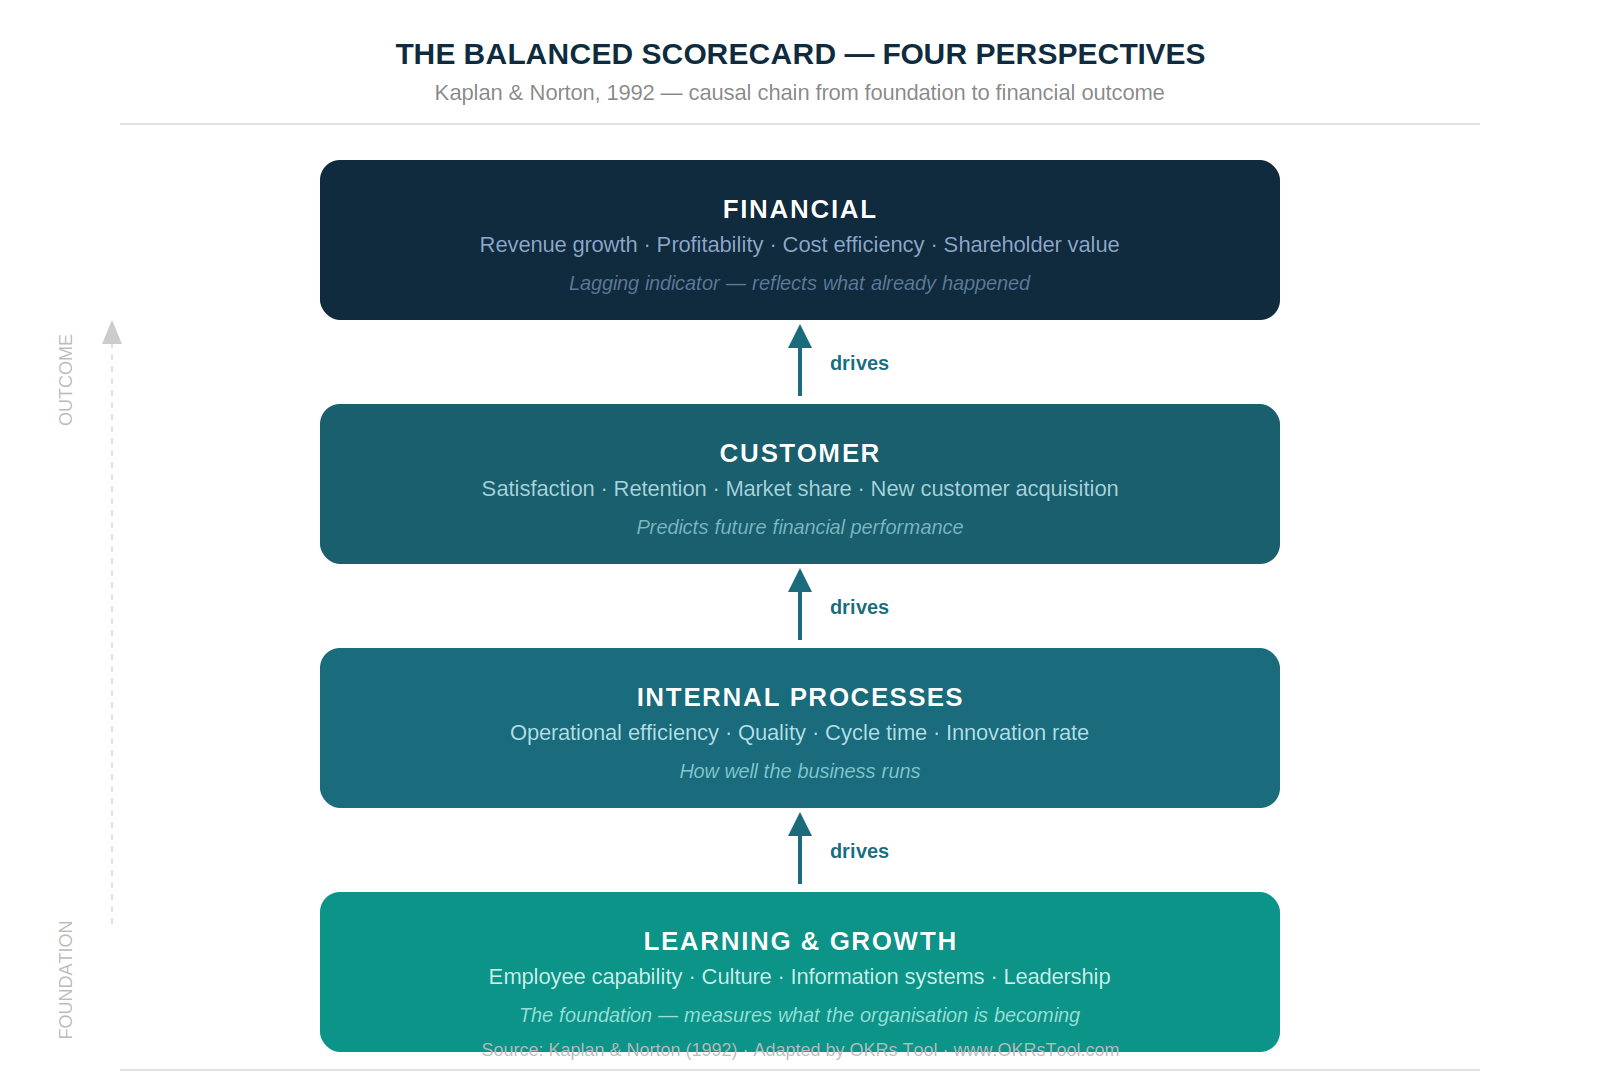
The BSC is a strategic measurement framework. It tracks performance across four perspectives simultaneously:
Financial — revenue, profitability, cost efficiency. The lagging indicators that most organizations were already tracking.
Customer — satisfaction, retention, market share. The signals that predict whether financial performance will hold.
Internal Processes — operational efficiency, quality, cycle time. Whether the business is running well enough to sustain the customer outcomes above.
Learning & Growth — employee capability, information systems, organizational culture. The foundation that makes everything else possible.
The BSC's fundamental insight is that these four perspectives are causally connected: investment in learning and growth drives better internal processes, which produces better customer outcomes, which generates better financial results. Managing only the financial layer is managing the output of a system you're not actually watching.
Where the BSC breaks down at 50–200 people is precisely this causal chain. Measuring all four perspectives quarterly is valuable when you have the management infrastructure to act on the data between reviews. At 80 people, you don't have four functional heads running BSC reviews — you have a leadership team that needs to know what's on track, what's stalled, and who's doing something about it this week.
The BSC has no weekly accountability mechanism. No named owner per metric. No automated check-in that surfaces problems before they become misses. It's a measurement system, not an execution system.
What OKRs Actually Do
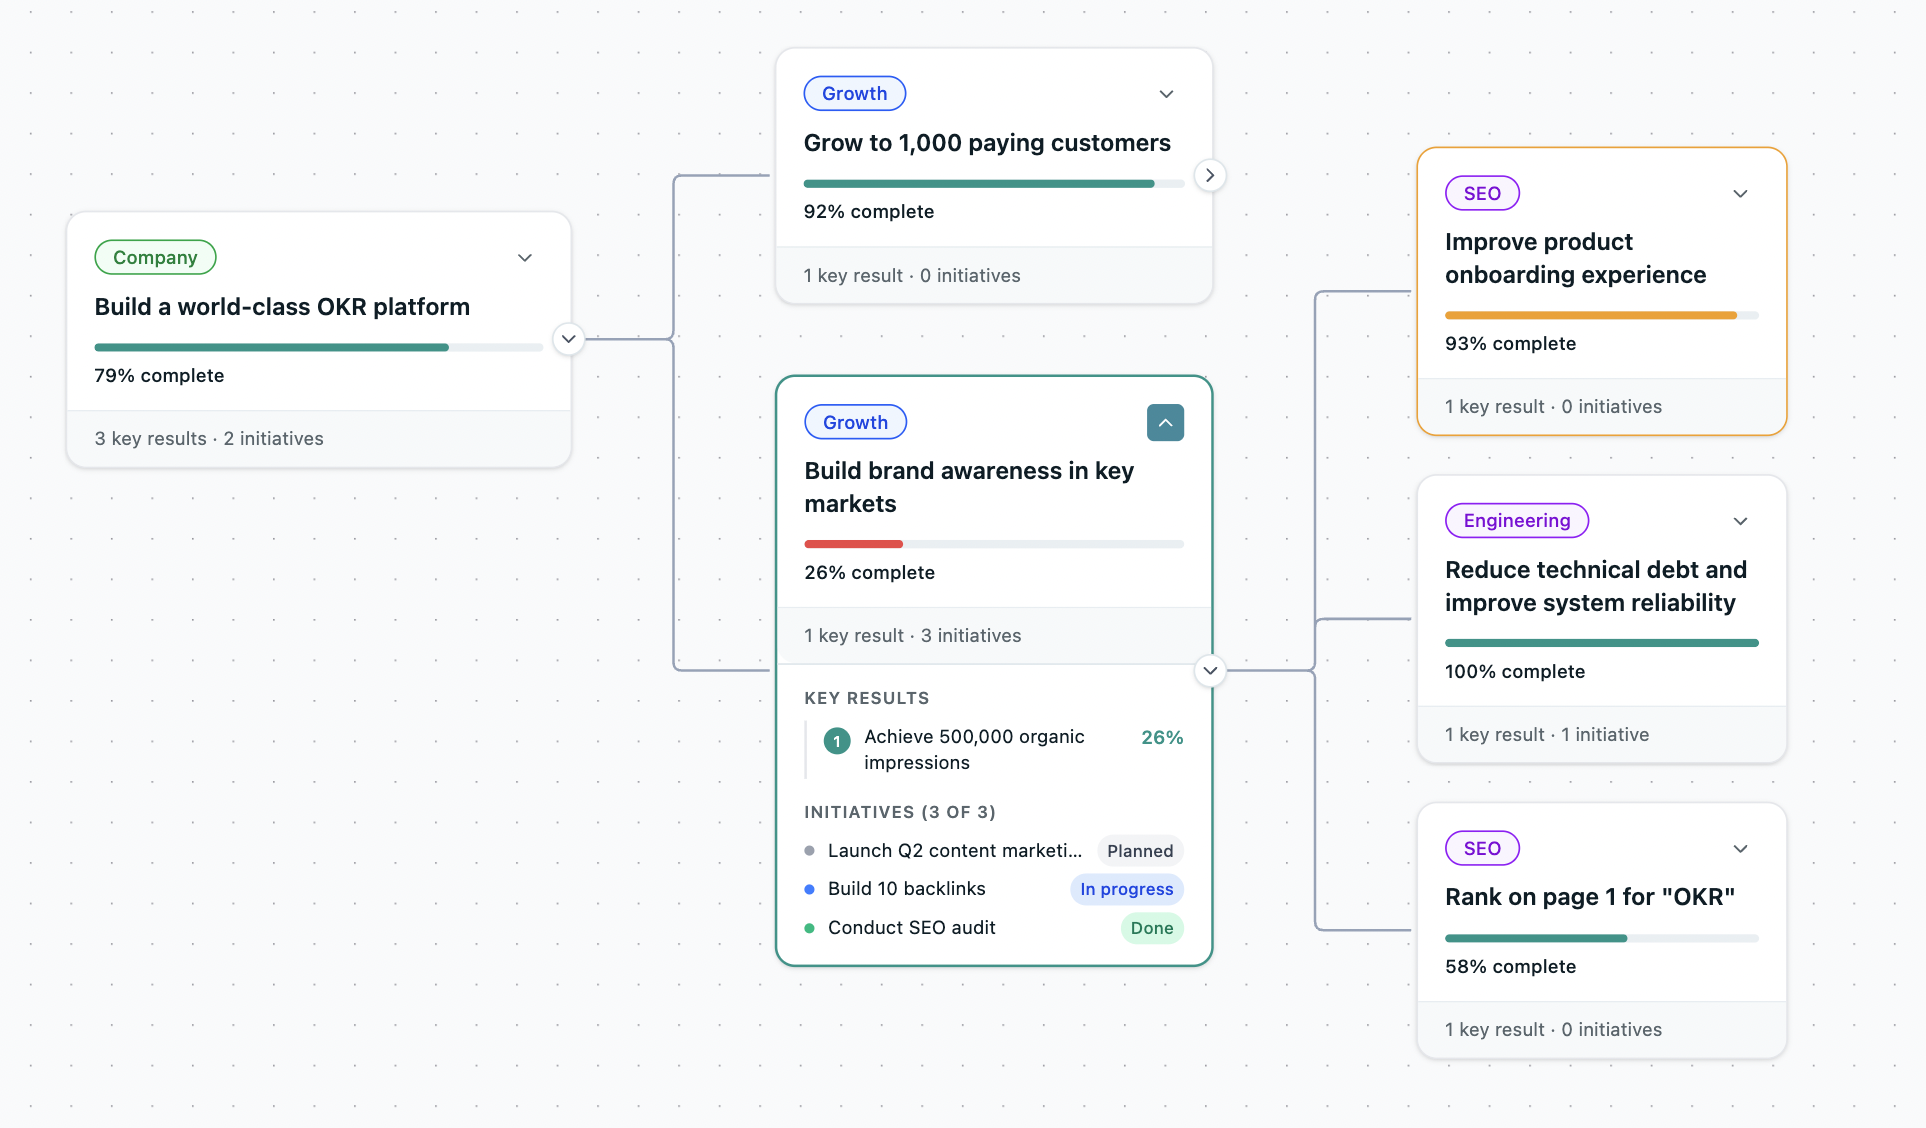
OKRs operate at the execution layer the BSC doesn't reach. A quarterly Objective sets the direction. Two to four Key Results define what needs to change, with specific baselines and targets. A single named owner per Key Result makes accountability concrete. A weekly check-in via Slack or Teams makes progress visible before it becomes a problem.
The 2026 OKR Benchmark Report found that 65% of teams admit their goals aren't clearly linked to company strategy. That's not a measurement problem — it's an alignment problem. OKRs fix it structurally: every team Key Result must connect to a company Objective before the cycle starts.
Teams with automated weekly check-ins complete 43% more OKRs than those reviewing monthly. Teams with required single ownership see 26% higher completion rates. Those aren't measurement improvements — they're execution improvements driven by structural accountability.

The Critical Failure Mode
The most common failure when organizations adopt the BSC at the 50–200 person stage is this: the framework produces excellent quarterly diagnostics and no mid-quarter action.
Leadership reviews the BSC in month three. Customer satisfaction is declining. Internal process efficiency is lagging. The learning and growth metrics are flat. Everyone agrees this is a problem. Nobody knows who is specifically accountable for changing which metric by when, because the BSC doesn't name owners — it names perspectives.
By the next quarterly review, the same metrics are in the same positions, and the discussion is about why the numbers didn't improve rather than what specific owner failed to move what specific metric in what specific week.
OKRs solve this with a different architecture: the metric has a baseline, a target, a named owner, a weekly update cadence, and an at-risk flag when it hasn't moved. The problem surfaces in week four rather than week thirteen.
How They Compare
When the BSC Is the Right Call
For organizations above 500 people with a dedicated strategy function, the BSC earns its place. When the challenge is measuring whether a complex enterprise strategy is working across geographies, business units, and time horizons — and when you have the management infrastructure to act on four-perspective data between annual reviews — the BSC provides a coherence that OKRs alone don't attempt.
For boards and investors evaluating long-term strategic health across multiple dimensions, the BSC's structured view of financial, customer, process, and learning performance is more informative than a quarterly OKR scorecard.
The BSC also works well as a complement to OKRs at this scale: the Balanced Scorecard defines which strategic outcomes matter across the year; OKRs define what the organization will specifically change each quarter to move them.
The Verdict for Growing Teams
For teams between 30 and 500 people, OKRs are the right starting point — and for most, the right long-term framework. The quarterly execution cadence, named ownership, and weekly check-in rhythm address the actual failure modes at this stage: goals that aren't connected to strategy, accountability that's diffuse, and problems that surface too late to fix.
The BSC's measurement framework adds value when you have the infrastructure to act on it. Most growing teams don't — and adding the BSC overhead before the OKR execution habit is established produces four-perspective diagnostics and the same execution gap.
See how OKRs Tool implements the full execution cycle — from planning through weekly check-ins to retrospective — and why organizations using purpose-built OKR software generate a 1:88 return on investment versus 1:25 on spreadsheets.
Data: The ROI of OKRs: 2026 Benchmark Report (330 respondents), The 2026 OKR Benchmark Report (200+ organizations).