First-cycle teams complete 51% of their OKRs on average. By cycle five, the figure is 79%. What changes along the way is the process around the objectives: owners named before the quarter starts, a weekly check-in, a mid-cycle review that forces decisions, and a retrospective that changes the next cycle. Below are the five steps, what each requires, and the data on what each one is worth.
Set objectives in January, write the key results, align the teams, and let the quarter unfold. That version of OKRs is a planning exercise, and it tends to stall around the time the first check-ins should start. The completion gains in the benchmark data come from teams that run the full cycle every quarter, so progress stays visible, ownership stays clear and misalignment gets caught before it becomes a missed quarter.
The OKR process has five steps. Each one below comes with what it requires, the evidence behind it and the check to run before moving on. For the person accountable for OKRs at a growing company, the later steps carry the most weight, because steps four and five are where a rollout compounds or stalls.
What Is the OKR Process?
The OKR process is a structured cycle that repeats every quarter. It has five stages: setting objectives, writing key results, cascading goals across teams, tracking progress through weekly check-ins, and reflecting at cycle end to improve the next one.
The cycle is continuous. Each retrospective feeds the next planning session, which is how the OKR cycle compounds from one quarter to the next. Teams that drop steps usually drop the same two: the weekly check-in and the end-of-cycle retrospective. Both happen after planning week, when the quarter's other work is competing for attention.
Step 1: Define Clear, Ambitious Objectives
An Objective is a qualitative statement of direction: what the team is trying to achieve this quarter, and why it matters. Numbers belong in the Key Results, so the Objective itself carries none.
A strong Objective is ambitious enough to require real focus, specific enough to point every team member in the same direction, and clear enough that a new hire could read it and understand what the quarter is for. "Become the trusted partner for security-conscious enterprise buyers" is an Objective. "Grow the business" is too vague to steer anyone.
The 2026 OKR Benchmark Report is precise on scope: teams running 1–2 Objectives per quarter are twice as likely to achieve them as those running three or more. The instinct to be comprehensive, with goals for every function, priority and initiative, is the instinct that sinks first cycles. Constraint is the framework's main mechanism, and setting the right number of OKRs is the first place to apply it.
Step 2: Write Measurable Key Results
Key Results are the evidence that the Objective was achieved. Each one needs a baseline, a target and a metric that moves when the work succeeds.
"Increase Day 7 activation from 34% to 52%" is a Key Result. "Launch the new onboarding flow" is a task. The distinction matters because a task can be completed without moving the business. Across 20,952 Key Results in OKRs Tool platform data, 52% were tasks or KPIs in disguise, measuring what was done instead of what changed.
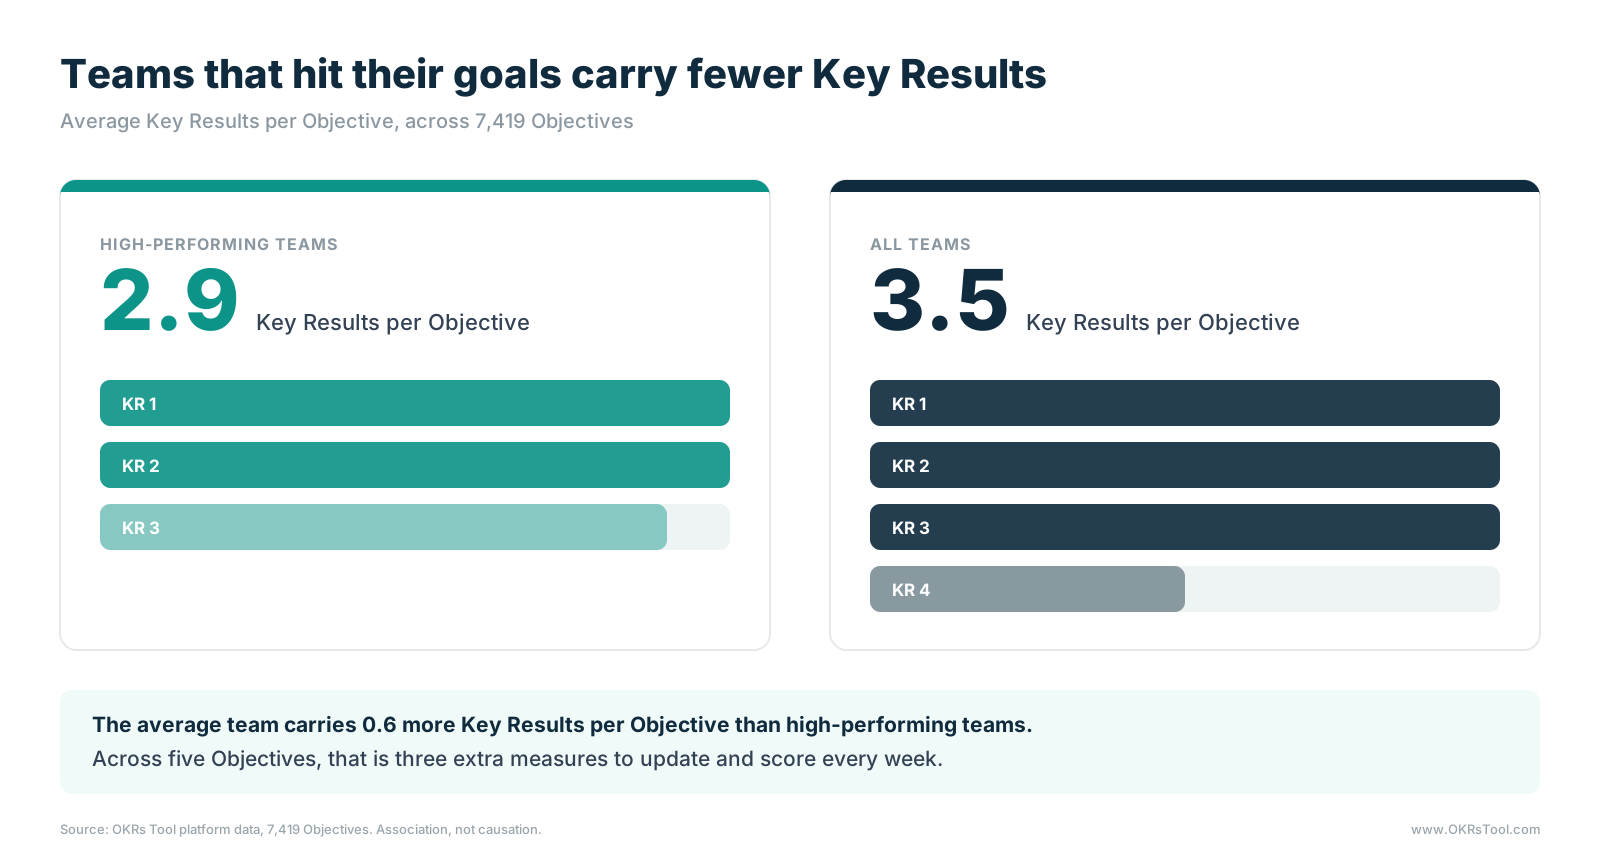
Each Objective should have 2–4 Key Results. Across 7,419 Objectives on the platform, high-performing teams average 2.9 Key Results per Objective, and overloading an Objective with measures correlates with worse outcomes (−0.25 completion score).
The chart below shows how completion changes with the number of Key Results on an Objective.
Step 3: Cascade and Align Across Teams
Company Objectives with no cascade beneath them stay a strategy deck. The cascade connects every team's Key Results to a company priority, explicitly and in one view, before the cycle starts.
The OKR Intelligence Report found that only 16% of organizations complete the full cascade, from company OKRs to team Key Results, within the same week. For the other 84%, teams spend the first two to four weeks without clear direction. Teams that complete the cascade in under a week see up to 50% higher completion rates than those taking three to four weeks.
The stakes go beyond a slow start. In the Growing Pains of OKRs study of 420 companies, the link between team and company goals separated programs that work from programs that stop.
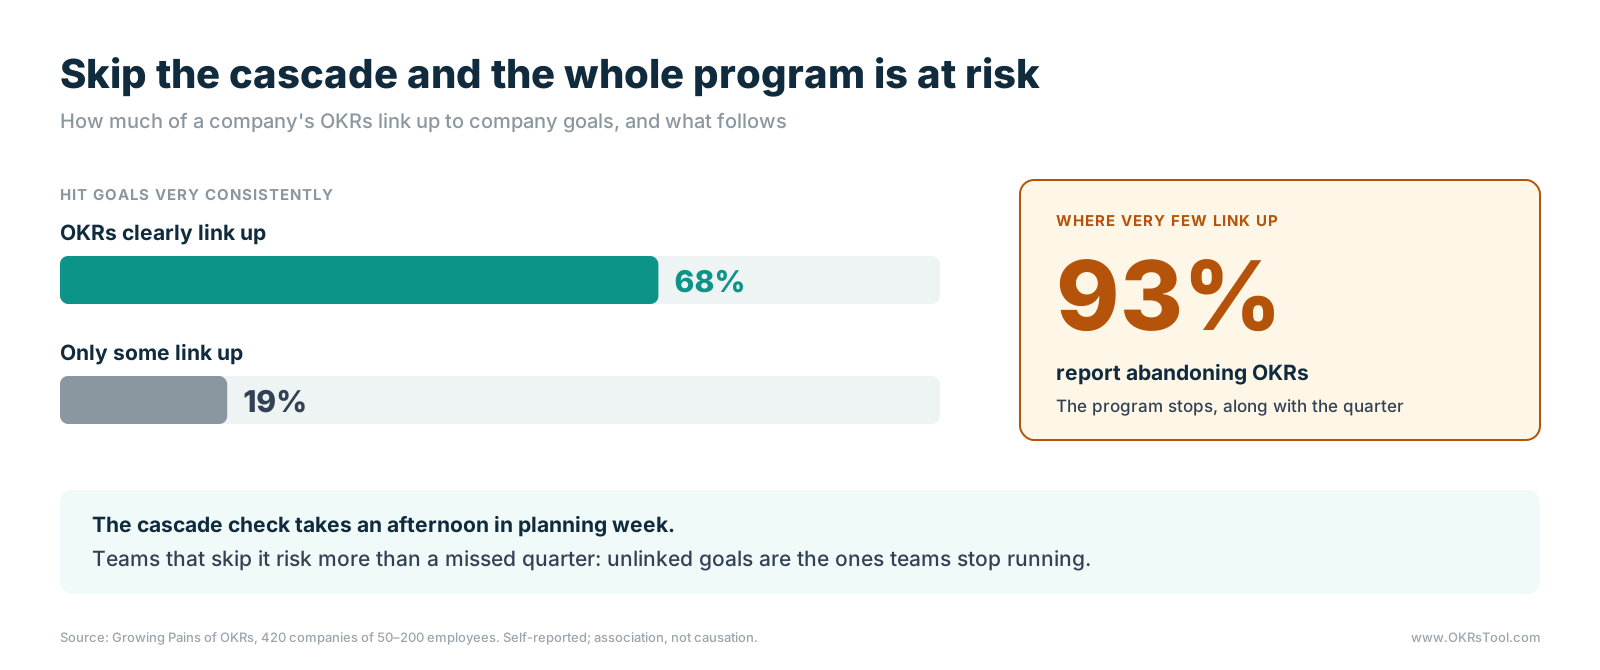
Where OKRs clearly link to company goals, 68% of companies hit their goals very consistently. Where only some link up, 19% do. Where very few link up, 93% report abandoning OKRs altogether. For the champion, an unlinked team goal is the first one to be treated as optional, and once a few teams treat OKRs that way, the program unravels.
The cascade check before going live has two parts. Every team Key Result should connect to a company Objective in one sentence, visible on the alignment map; if it takes a paragraph, the link won't hold once the quarter gets busy.
And every Key Result needs a single named owner before the cycle starts. In the same study, companies with an owner on every OKR hit their goals very consistently 65% of the time, against 17% where only some OKRs had one.
Step 4: Track Progress Through Weekly Check-Ins
The weekly check-in is the highest-return habit in the OKR process. Teams with one complete 43% more OKRs than those reviewing monthly or ad hoc, and teams that skip check-ins entirely are 3x more likely to abandon OKRs altogether.
A check-in is a structured update with four questions for each Key Result owner: what moved, what's at risk, what's the priority this week, and where help is needed. It runs at the same time every week via Slack or Microsoft Teams, so nobody has to remember to trigger it. The weekly check-in template has a ready-made format.
Two details of the check-in carry most of its value. The first is how progress gets recorded. Teams that update continuously hit their goals very consistently 59% of the time, against 28% for teams that rebuild the picture the night before a review. The second is scoring. Companies that put a confidence score on every Key Result hit their goals very consistently 66% of the time, against 22% for those that score only some.
The Mid-Cycle Review
Around week six, the mid-quarter review takes place. Every Key Result is scored on a 0.0–1.0 scale, and anything below 0.5 gets an explicit decision: revise the target, escalate the blocker, or formally close it. The OKR Intelligence Report found 7% of off-track Key Results are simply abandoned mid-cycle, dropped with no decision. The review closes that gap by making a decision mandatory.
Timing matters here too. In OKRs Tool platform data, Key Results stuck at zero at their first check-in that started moving within about six weeks recovered to 70% of target 66% of the time. Those that first moved after that point recovered 47% of the time. The mid-cycle review is the last scheduled moment to get a stalled goal moving while the odds are still good.
Step 5: Reflect and Refine at Cycle End
The end-of-cycle retrospective is where the OKR process compounds. Teams that run structured retrospectives complete 30–45% more OKRs the following cycle. The gain comes from understanding why the previous cycle produced the results it did, and from making three or four specific structural changes before the next cycle starts.
The retrospective covers four questions: what was achieved and what drove it, where the cycle fell short and why, what structural changes would improve the next cycle, and which of those changes the team commits to before the session closes. A session that ends with intentions and no committed changes leaves the next cycle exactly where this one was.
Retros also complete a set. In the Growing Pains study, four habits ran together: a weekly check-in, real-time tracking, full ownership and consistent retros. Companies running none of the four hit their goals very consistently 10% of the time. Companies running all four reached 80%.
The retrospective's outputs feed the next cycle's planning session. The cascade check is tighter, the Key Results are sharper and the ownership assignments are cleaner. Repeated across cycles, that's how 51% in cycle one becomes 79% in cycle five on the OKR maturity curve.
Where the Process Breaks in Practice
Teams that describe their goal process as consistent often run only part of it. The Goal-Setting Benchmark asked 280 Ops and Strategy leaders how they run goals, and the answers from teams that say they apply their framework consistently show where the gap opens.
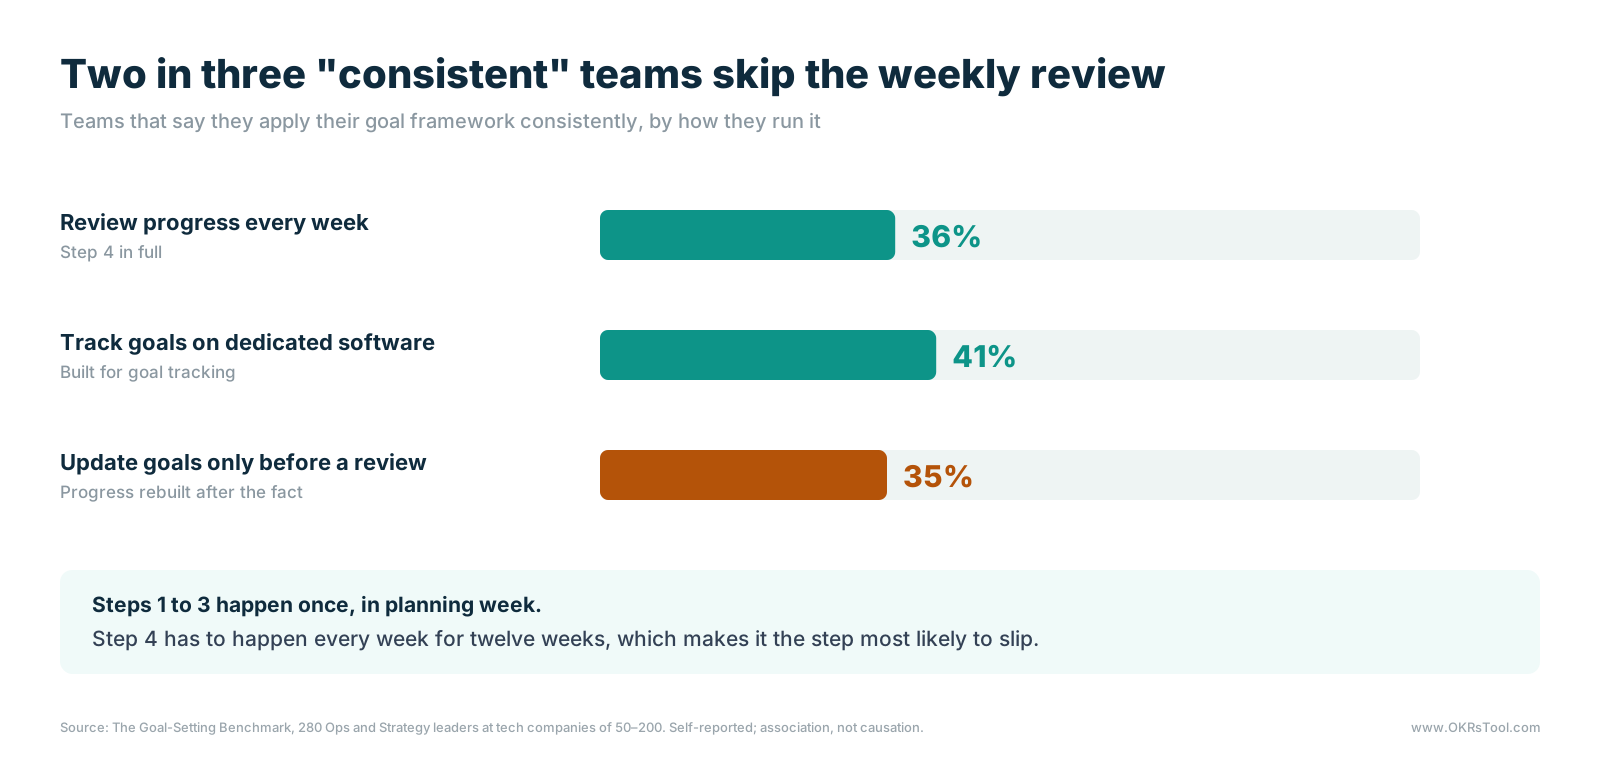
Only 36% of those teams review progress weekly, and 35% update their goals only before a review. Steps one to three happen once, in planning week, with everyone in the room. Step four has to happen every week for twelve weeks, alongside everything else, and without a system behind it, the check-in becomes the step that slips.
For the champion, this is the most useful diagnostic in the process. The table below sets out one check per step, with the benchmark to hold it against.
The Tool That Makes the Process Work
A spreadsheet can store an Objective and a few Key Results. It can't send an automated check-in reminder, require a named owner before a goal goes live, flag at-risk goals before they become misses, or show leadership a live alignment map without a status meeting. Those gaps all fall on steps three to five, the steps that decide the outcome, which is why OKR tracking in spreadsheets tends to stall after the first cycle.
The alignment map is the clearest example: the cascade from step three, visible to leadership in one live view.
OKR software that builds the full five-step process into the workflow, with automated reminders, required ownership, a live alignment map and a retrospective built in, is what the ROI of OKRs benchmark links to a 1:88 return, against 1:25 for spreadsheet programs on the same revenue baseline.
The return on OKRs comes from running the process every quarter, and the process runs consistently when the infrastructure does the remembering. The OKRs Tool platform sends every owner a weekly check-in, requires an owner on every Key Result and keeps the alignment map live, so the champion spends review meetings on decisions.
Data: The ROI of OKRs: 2026 Benchmark Report (330 respondents); The 2026 OKR Benchmark Report (200 organizations); OKR Intelligence Report 2026 (222 organizations); the Growing Pains of OKRs study (420 technology companies of 50–200 employees); The Goal-Setting Benchmark (280 Ops and Strategy leaders); OKRs Tool platform data (876 organizations, 7,419 Objectives, 20,952 Key Results)