
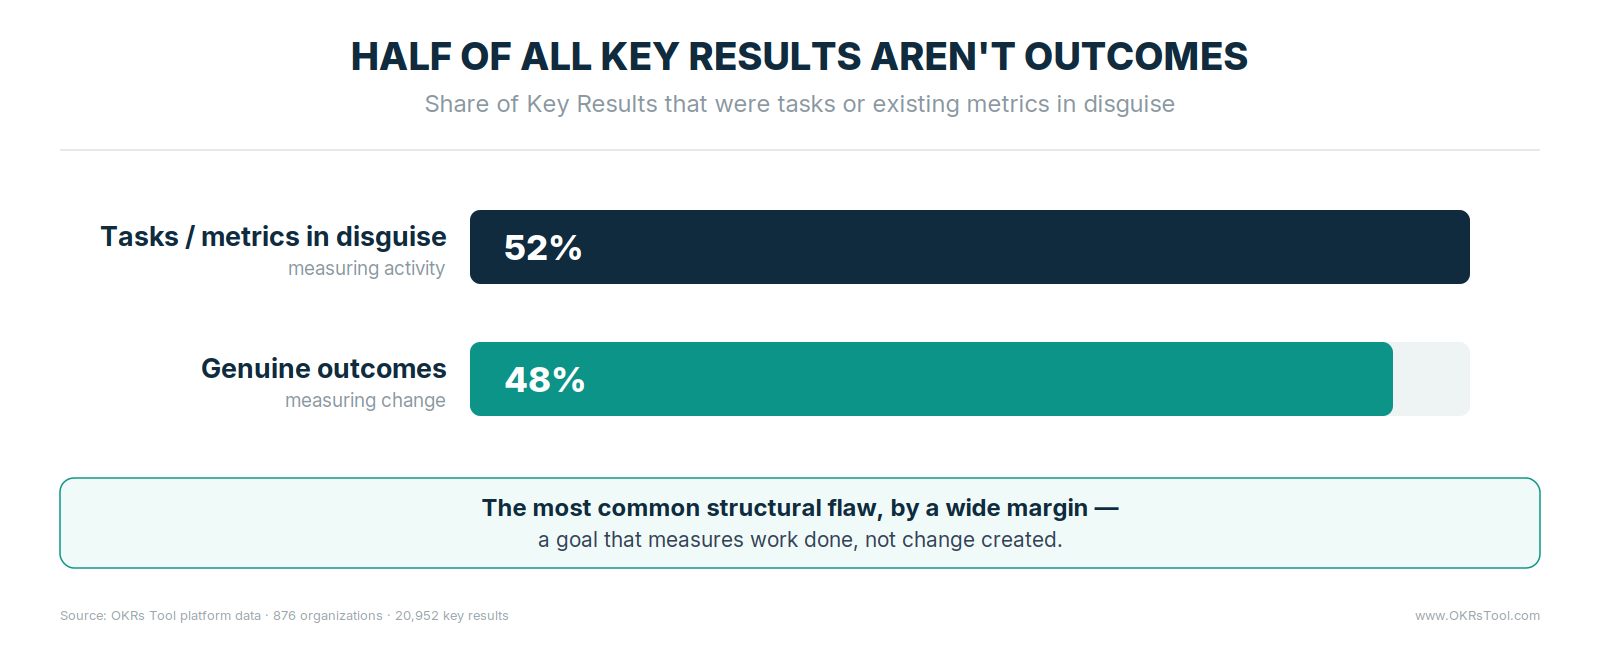
Across 876 organizations, 52% of Key Results were tasks or existing metrics in disguise — not outcomes a team was actively trying to change. A strong team goal comes down to a structural test, not better wording: does it describe an outcome the team can influence, does it connect to a company priority, and does a real number move week to week? Most goals that read well fail at least one.
A strong team goal describes a change the team can create, connects to a company objective the team can name in one sentence, and tracks progress with a measurable number that moves — not language anyone has to interpret. The structure underneath it is consistent: a clear outcome the team influences, a measurable indicator of progress, and a defined timeframe.
The hard part is in execution, not the writing. Most goals set during planning read well and then fail to change how work happens during the quarter. A goal with no owner doesn't get updated. A goal disconnected from strategy produces effort that doesn't compound. A goal measured in adjectives can't be tracked. Each of those is a structural flaw, and each one has a measured cost.
The Five Structural Tests
Whether a team goal survives the quarter comes down to five structural properties, and the platform data attaches a number to each. Each quality criterion has a measured cost when teams get it wrong.
The first test is whether the goal is an outcome or an activity. Activities describe work being done; outcomes describe the change that work should create. Teams confuse the two because activity feels measurable and controllable, while an outcome requires a claim about impact.
This is the most common failure by a wide margin — 52% of Key Results across growing teams were tasks or existing metrics dressed up as outcomes. "Improve onboarding" is an activity. "Increase onboarding completion from 62% to 80%" is an outcome.
The second test is alignment. A team can execute flawlessly and still create limited value if its goals aren't connected to what the business is trying to achieve. The 2026 OKR Benchmark Report found 65% of teams admit their goals aren't clearly linked to company strategy — the single most common structural gap in the data. Alignment becomes real when a team can state in one sentence how its goal moves a company objective forward.
The third test is measurability. If a team can't tell whether it's closer to the outcome, the goal can't be managed during execution. Words like "improve," "increase," and "optimize" — the kind that make an OKR fail — become meaningful only when paired with a measurable change from a baseline to a target.
The Two Tests That Decide Whether a Goal Moves
The three properties above are necessary but not sufficient. Two more determine whether a well-written goal actually produces anything.
The fourth test is ownership. A goal can be a perfect outcome, aligned and measurable, and still go nowhere if nobody owns it. Roughly 50% of Key Results in the platform data have no named owner at all, and required single ownership drives 26% higher completion. The owner doesn't do all the work — they own the number being current and honest every week.
The fifth test is movement. Whether a Key Result ever got updated during the cycle predicted goal success more reliably than any other variable in the dataset. Teams that kept their numbers moving hit their goals 68% of the time; teams whose Key Results went dark hit 35%.
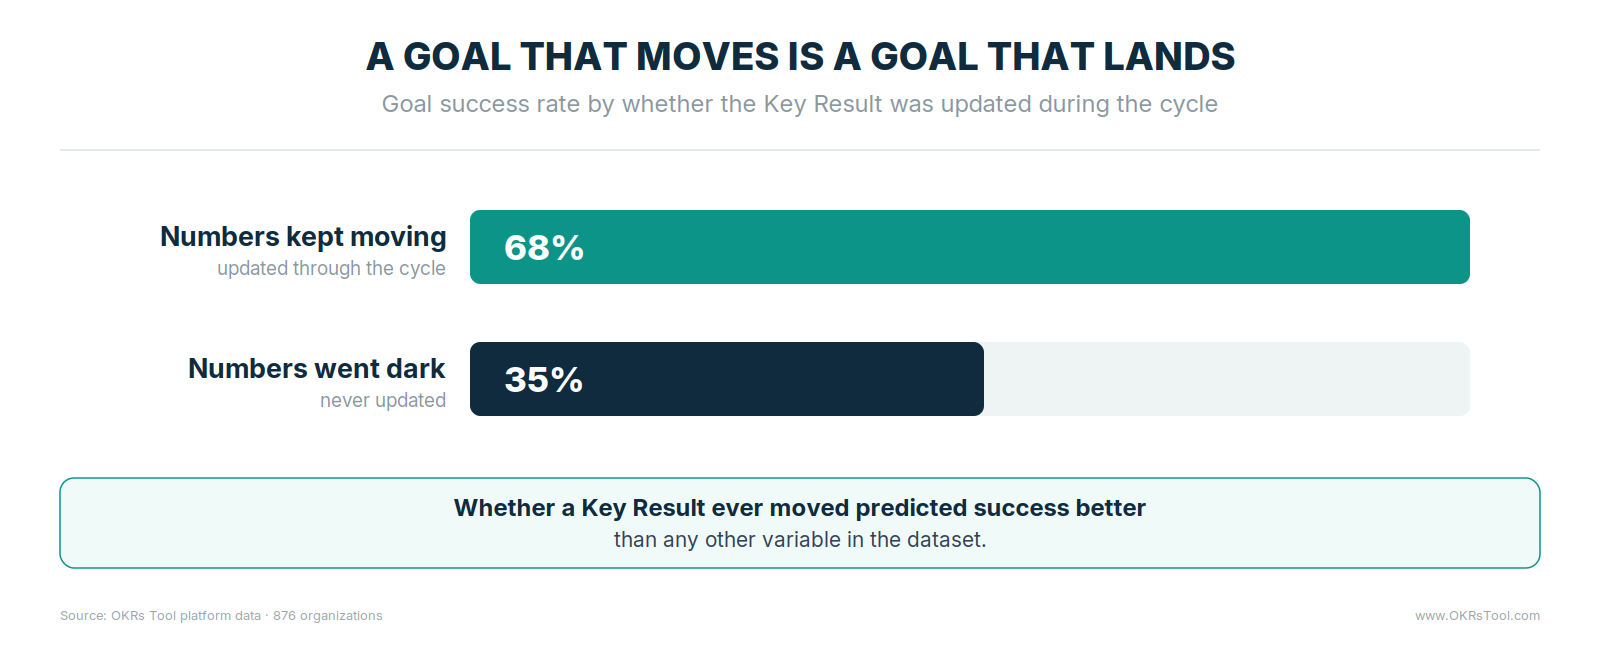
A goal that reads perfectly and never moves ends the quarter as a planning artifact, however good it looked in week one.
These two tests are why goal-setting and goal-tracking can't be separated. A goal written to survive execution assumes an owner and a weekly pulse. Without them, the other three properties are cosmetic.
Aligning Team Goals With Company Priorities
The most common failure point is the second test — alignment. Leadership communicates a direction during planning, and teams translate that direction differently once they start writing their own goals. The 65% misalignment figure is what that translation gap looks like at scale.
The simplest way to hold alignment is to start with a company-level objective and ask a practical question: what outcome could this team influence that would materially help achieve it?
If a company objective focuses on retention, the product team might improve onboarding completion, customer success might start renewal conversations earlier in the lifecycle, and support might reduce response times on critical issues. Each goal serves the same priority while staying specific to the team that owns it.
When alignment works, teams can see how their work contributes to company outcomes without needing interpretation from leadership. The cascade from company objective to team goal is visible rather than assumed.
Tracking Progress During the Quarter
A team goal only influences execution if it stays visible through the quarter. Without a regular check-in, goals become planning artifacts rather than operating tools — which is the fifth test failing in slow motion.
Teams that check in weekly complete 43% more OKRs than those reviewing monthly or ad hoc. The review should focus on movement toward the measurable outcome rather than task completion: current progress, what changed since last update, what's blocked, and what adjustment keeps momentum.
The benchmark data is direct on duration too — teams spending more than 30 minutes a week on review perform worse than those spending less. Intentional time, not more time.
At cycle end, the most valuable step is understanding what the outcome reveals about how the goal was set, not just recording whether it was hit. A goal achieved early may have been sandbagged; one that fell short may have rested on a wrong assumption about a dependency. Those retrospective questions are what make the next cycle's goals sharper.
18 Examples of Strong Team Goals
Each example below describes a measurable outcome the team can influence directly, connected to a broader company priority. Every one passes the first three tests — outcome, measurable, time-bound — and is written to be owned and tracked weekly.
The pattern is consistent across all six functions: a baseline, a target, and a metric that moves week to week. None of them is a task. Each states where the number is now and where it needs to go — which is exactly what makes it trackable in a weekly check-in rather than a source of interpretation at quarter end.
What Strong Team Goals Look Like
The difference between a weak and a strong team goal is visible the moment you put them side by side. The weak version names a topic; the strong version names a movement.
Turning Team Goals Into a System
Writing a strong goal is the starting point. The value appears when the goal becomes part of an operating rhythm — connected to a company priority, measured through the quarter, and reviewed at a retrospective. That's the point where goal-setting becomes execution management rather than a planning-week ritual.
This is the rhythm structured frameworks like OKRs exist to support: company objectives stay visible on one platform, team goals stay measurable and owned, and the weekly pulse keeps the numbers moving. A goal that guides what a team works on, how progress is measured, and how the organization learns each cycle is worth more than a perfectly worded target nobody updates.
Data: OKRs Tool platform data (876 organizations, 7,419 objectives, 20,952 key results), The 2026 OKR Benchmark Report (200 organizations).