
These goal setting statistics come from seven original studies run in 2026 — covering more than 2,000 organizations, 20,952 key results, and 5,000 goal cycles. Across all of them, one pattern holds: goals are won or lost in the weeks after they're written, where 60% of failing priorities are never cleanly resolved and only 7% of daily work ladders up to strategy.
The goal setting statistics floating around the web are mostly recycled from a handful of decade-old surveys. The numbers below are new. They come from seven benchmark studies run in 2026 across more than 2,000 organizations, each measuring a different part of how goals get set, tracked, and hit, or abandoned along the way.
This guide groups the most useful goal setting statistics into eight themes, with each figure attributed to the study it came from, so you can see not just what's true but where the number is from. They sit inside the wider practice of goal setting, where the same pattern runs through every study: structure and habits decide the outcome more than the wording of the goal.
The Framework Barely Predicts Success
Before the specific gaps, the finding that reorders how to read every statistic below: which framework a team runs is one of the weakest predictors of whether it hits its goals.
The Goal-Setting Benchmark (280 operations and strategy leaders) scored teams on four habits — weekly review, continuous tracking, visible goals, and dedicated software — and plotted how consistently each group hit its goals. The result climbs at every step: 15% with no habits, then 21%, 36%, 51%, and 71% with all four.
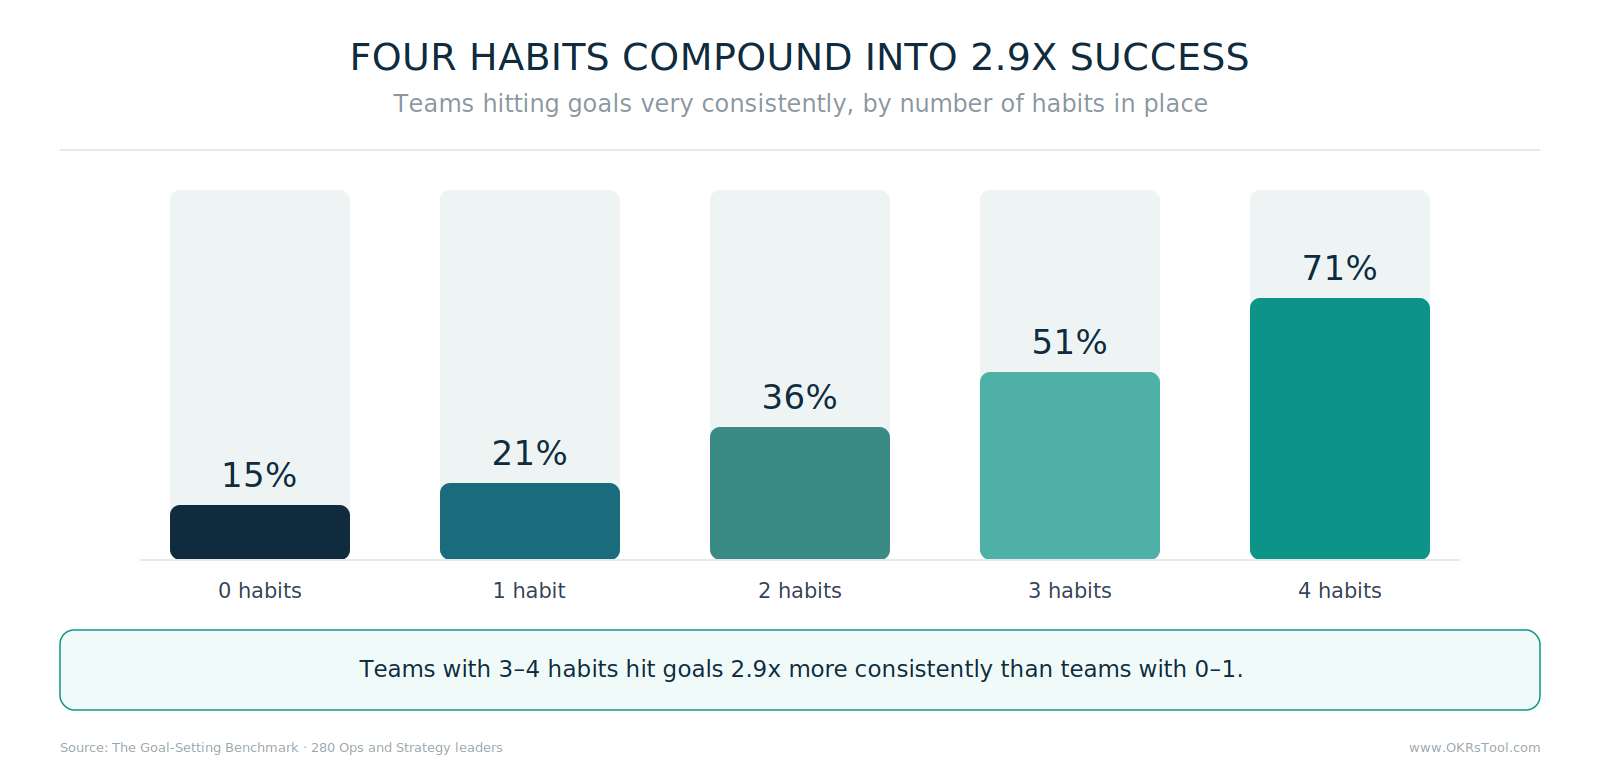
Teams with three or four habits hit their goals 2.9x more consistently than teams with zero or one (Goal-Setting Benchmark). The framework itself barely moved the number — SMART leads the market at 39%, KPIs sit at 16%, and OKRs at just 4%, yet none of those labels predicted success the way the habits did.
Two cuts of the same data show why. Split teams by how well they set goals and how well they track them, and the winning quadrant is both: set-and-track-well teams hit their goals very consistently 51% of the time, against 33% for a rough goal tracked closely, 29% for a polished goal left to drift, and 18% for teams weak at both (Goal-Setting Benchmark). A goal tracked well beats a goal merely written well.
The catch is that most teams only claim the discipline. Among teams saying they apply a framework consistently, only 36% actually review weekly, only 41% run on dedicated software, and 35% update their goals just before a review (Goal-Setting Benchmark). And skipping the habits has a price: 59% of teams lose an hour or more every month reconstructing where goals stand, and 66% see work duplicated because goals aren't visible in one place. Every statistic that follows measures one of those four habits, or the cost of skipping it.
Strategy Alignment Statistics
The first place goals break is the connection between daily work and the strategy it's meant to serve — and it breaks early, often before a single key result is written.
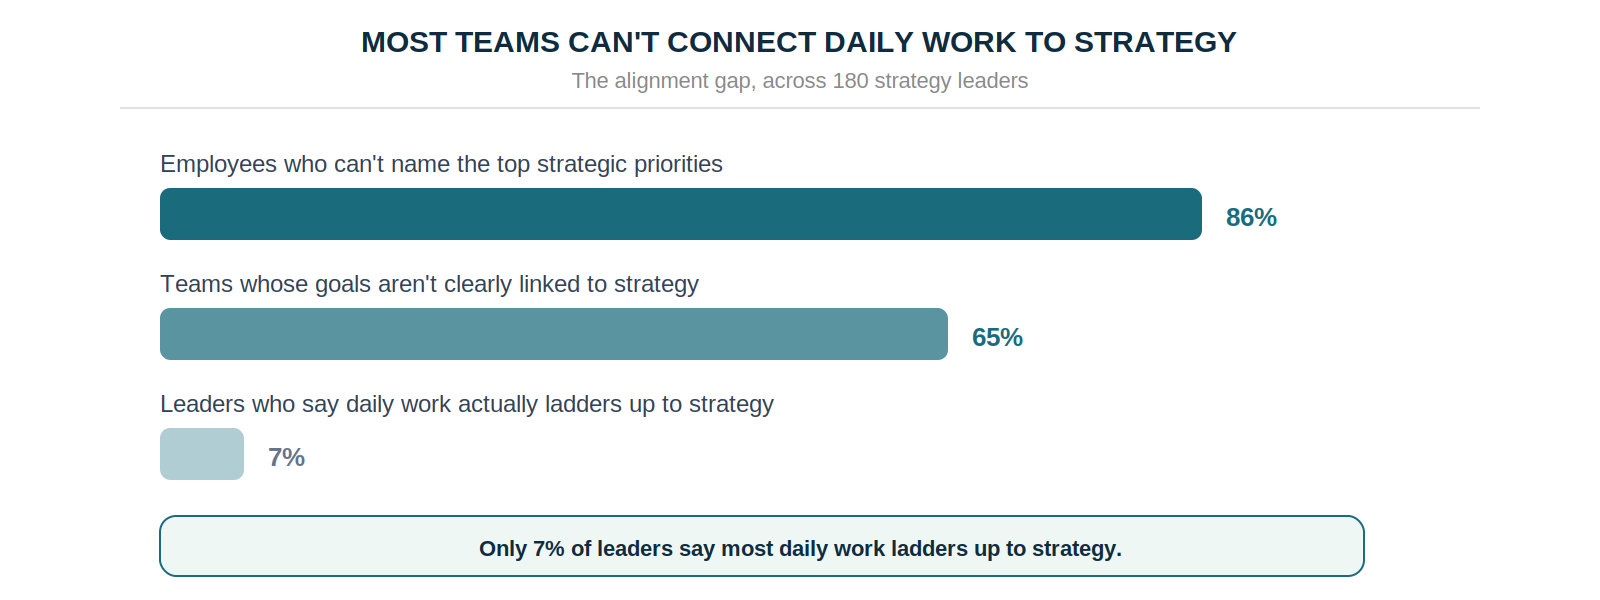
In 86% of companies, most employees can't name the top strategic priorities (Strategy Execution Benchmark 2026, 180 leaders). That figure is easy to read past, so it's worth sitting with: in roughly nine of every ten organizations, the average person doing the work could not tell you what the company is trying to achieve this year. Strategy exists — it was presented at an offsite, it lives in a deck — but it never made the journey from the leadership team's heads into the daily awareness of the people executing it.
The downstream numbers follow logically from that first one. Only 7% of leaders say most of their teams' daily work actually ladders up to strategy (same study), and 65% of teams admit their goals aren't clearly linked to company strategy at all (2026 OKR Benchmark Report, 200 organizations). Those three figures are the same gap measured at three depths. When people can't name the strategy, their goals don't connect to it, and when the goals don't connect, the daily work can't either.
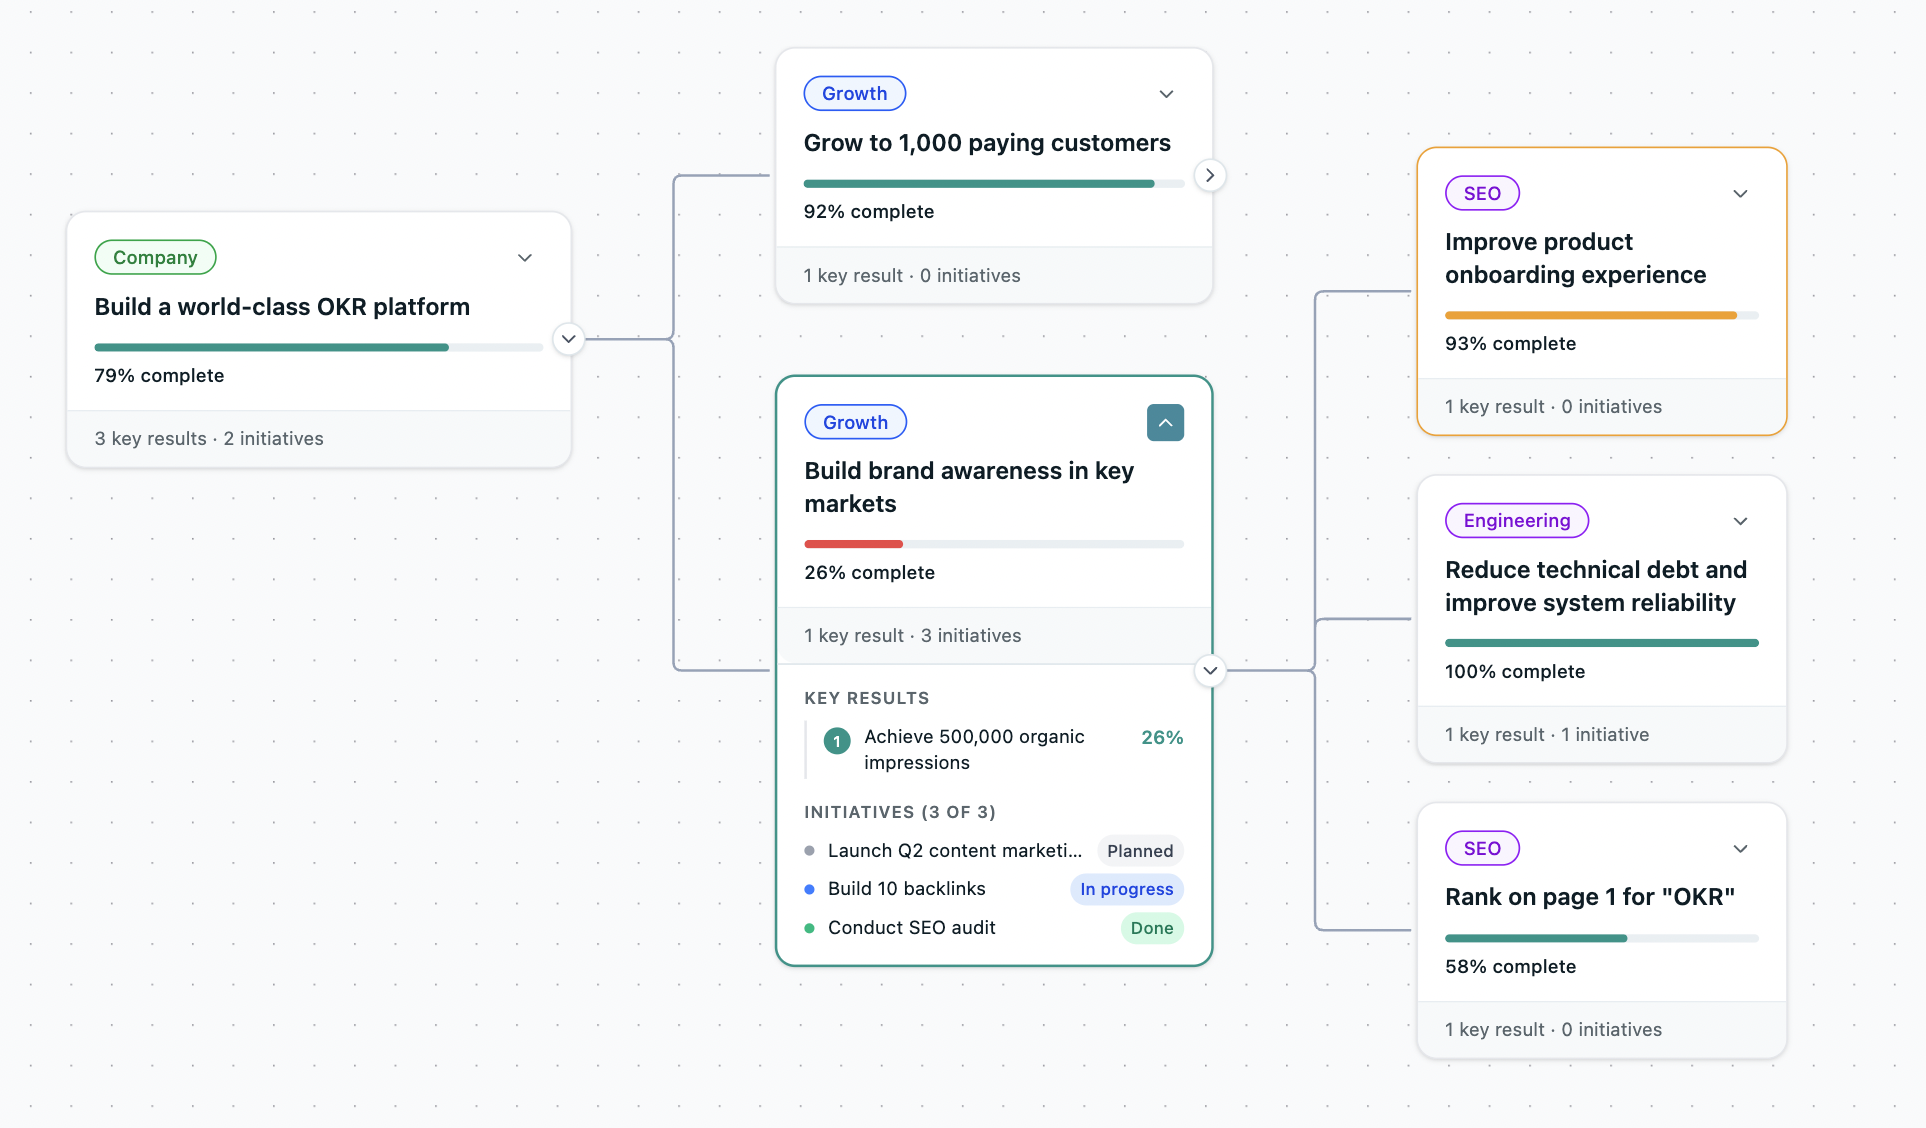
Alignment gets talked about more than any other benefit of goal setting and achieved less than almost any, largely because teams treat it as a communication task ("share the strategy") rather than a structural one. Every goal has to physically link to a higher goal through a live cascade, or the connection stays aspirational.
Ownership Statistics
A goal without a clear owner is a goal nobody is accountable for, and the data shows how routine that failure is even in organizations that take goals seriously.
Half of all key results have no named owner (OKRs Tool platform data, 876 organizations and 20,952 key results). This is rarely carelessness. It's what happens when goals are set collaboratively and ownership is left collective.
"The team owns this" sounds healthier than singling one person out, but it produces the diffusion-of-responsibility effect every operator has watched play out: when everyone owns a goal, the weekly update is nobody's specific job, so it doesn't happen, and the goal drifts without anyone feeling responsible for the drift.
The cost of that shows up directly in completion. Teams that enforce a single named owner per goal see 26% higher completion rates than those with shared or vague accountability (2026 OKR Benchmark Report, 200 organizations). Put the two figures side by side and the improvement lever is obvious: half of goals are unowned, and ownership is worth a 26% completion swing.
Very few interventions in goal setting are that cheap — assigning a name costs nothing and requires no new tooling, yet the platform data shows it's the step teams skip most often. It works because a named owner creates a single person whose job is to notice when the goal is slipping, which is the earliest point at which anything can be done about it. The mechanism is attention, not pressure.
Goal Quality Statistics
Even when goals get set and owned, plenty don't measure what they claim to, describing activity dressed up as an outcome.
Across 20,952 key results, 52% turned out to be tasks or KPIs in disguise rather than genuine outcomes (OKRs Tool platform data, 876 organizations). The tell is in the verbs. The most common openers across the dataset — "complete," "launch," "implement," "build" — all describe work a team will do, not the change that work is supposed to cause. "Launch the new onboarding flow" is done the day it ships, whether or not a single activation metric moves.
A real key result would name the change: activation from 25% to 40%. The 52% figure means more than half of all goals can be fully "achieved" while the business is exactly where it started.
Quality also compounds with experience, which is one of the more hopeful findings in the set. Teams in their first two cycles complete 51% of their goals; teams past cycle five reach 79% (platform data) — a 28-point gain.
That improvement comes from repetition rather than a better template or a smarter framework — the framework is identical at cycle one and cycle five. Teams learn, cycle by cycle, to catch the task-shaped key result before it goes live, to set targets that are ambitious without being fantasy, and to write the outcome instead of the activity.
The implication for a team starting out is that early cycles will feel disappointing, and that's normal — the maturity curve is real, and the returns arrive with persistence rather than cleverness.
Goal Honesty Statistics
The set's most uncomfortable numbers are about how often goals get gamed rather than genuinely pursued.
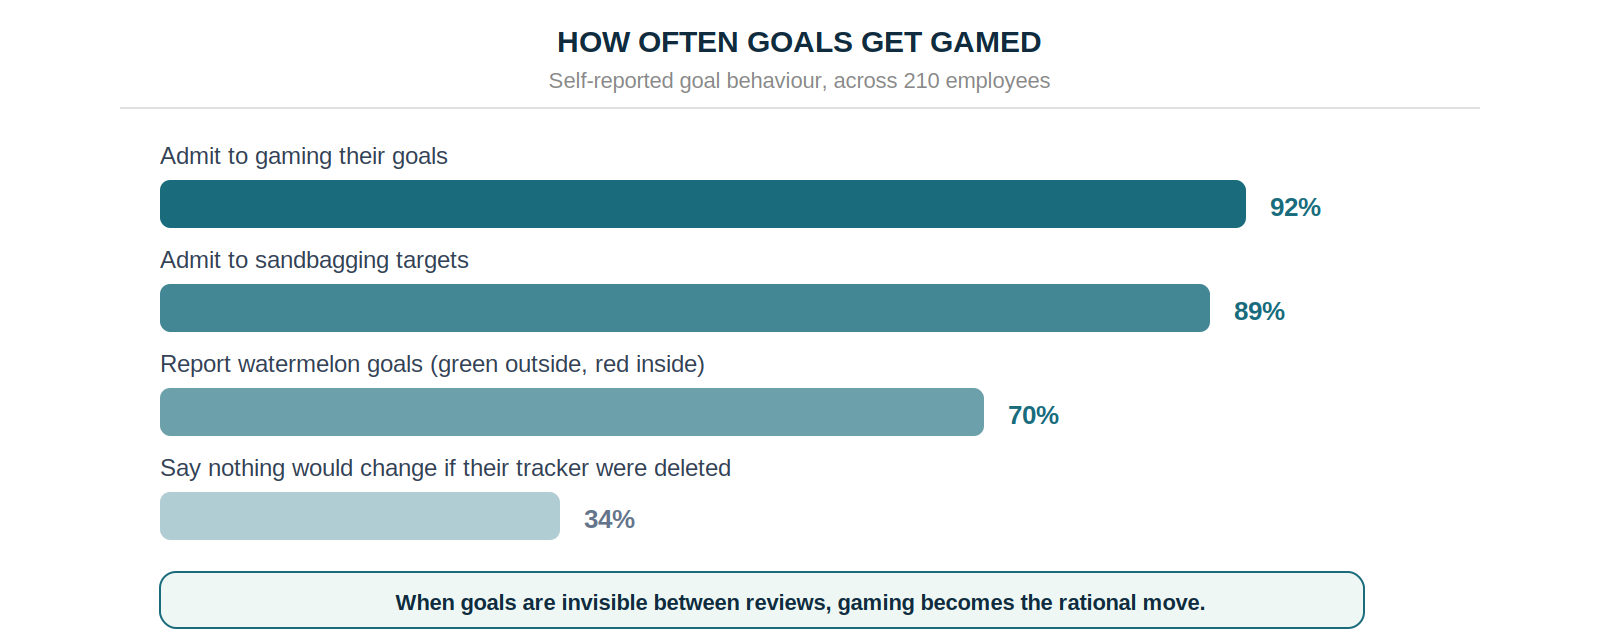
The State of Goal Management (210 employees) found that 92% admit to gaming their goals in some form, and 89% to sandbagging — setting targets deliberately low so the win is guaranteed before the quarter even begins. 70% report "watermelon" goals: green on the status report, red underneath. These numbers are high enough to make clear that gaming is near-universal, and near-universal behaviour is a response to conditions rather than a character flaw in a few bad actors.
Those conditions are worth naming, because they're fixable. When a goal is scored once at the end of the quarter and invisible in between, the smartest move for anyone being evaluated is to manage the appearance of progress rather than the progress itself — sandbag the target, keep the status green, explain the gap at the review. One figure lands harder than the rest: 34% say nothing about how they work would change if their goal tracker were deleted tomorrow.
For a third of people, the goal system is pure theatre, disconnected from the actual work. The fix is structural, not a motivational poster: remove the conditions that make dishonesty rational by keeping goals visible and reviewed often enough that the appearance of progress and real progress become the same thing.
Cadence and Review Statistics
How often goals are reviewed predicts completion more reliably than how well they're written — the rhythm matters more than the wording.
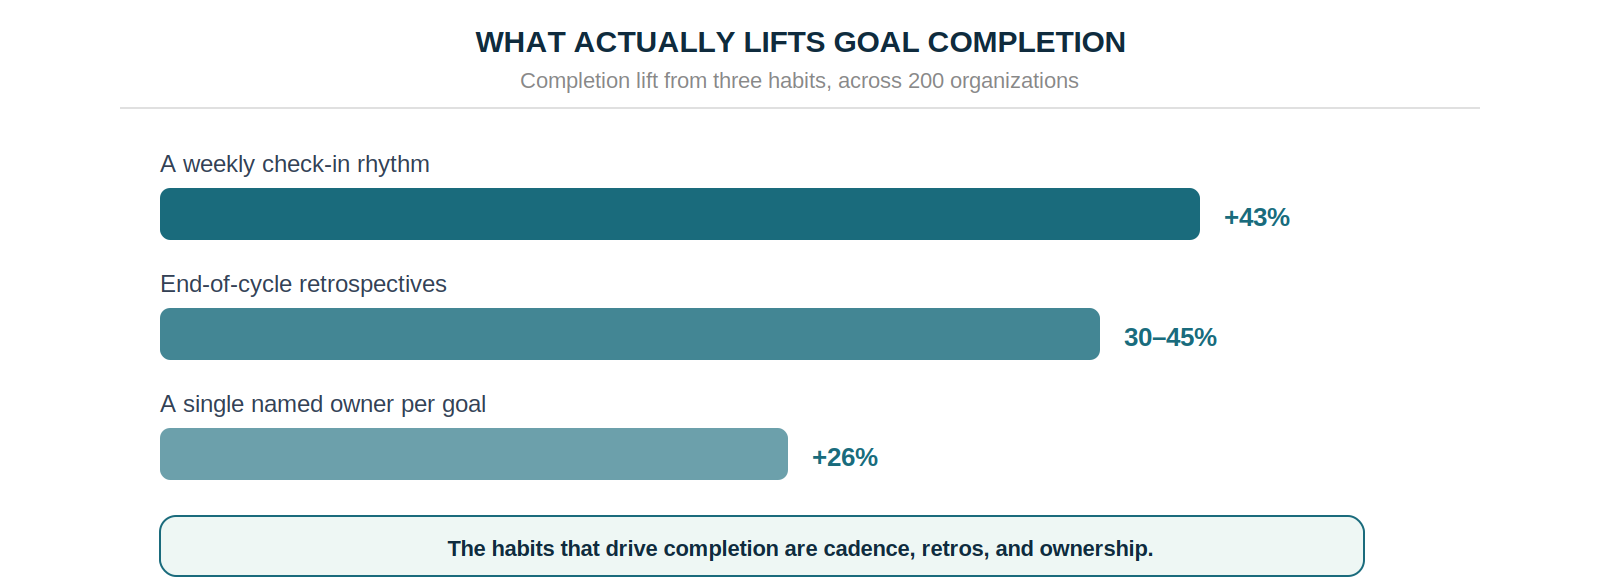
Teams with an automated weekly check-in complete 43% more of their goals than those reviewing monthly or ad hoc (2026 OKR Benchmark Report, 200 organizations). The mechanism is drift detection: a goal reviewed weekly can be corrected in week three, while a goal reviewed monthly isn't known to be off track until week four or five, by which point half the runway is gone.
The word "automated" is carrying weight in that sentence — check-ins that depend on someone remembering to schedule them decay within a few cycles, which is why the tooling that makes the cadence happen without human prompting is what separates the teams that sustain it from the teams that mean to.
Two more cadence findings sharpen the picture. Teams that close each cycle with a retrospective complete 30–45% more the following quarter (same study) — the review is where a team converts a missed goal into a changed process, which is the entire mechanism behind the maturity curve above.
And on an analysis of more than 5,000 goal cycles, quarterly cycles hit 46% completion against 34% for six-month cycles, with 14% of six-month cycles ending at exactly zero measurable progress. The longer the cycle, the more room for a goal to drift unnoticed, and the more likely it flatlines without a sound. A shorter cycle reduces the window in which a goal can fail before anyone catches it — the urgency is a side effect, the shrinking window is the point.
AI and Goal Setting Statistics
AI has moved from novelty to default in how goals get written and analysed, and the interesting finding is about what it does to honesty.
83% of organizations now use AI somewhere in their goal process (OKR Intelligence Report 2026, 222 organizations) — 51% for writing goals and 49% for analysis. Adoption that broad, that fast, means AI in goal setting is no longer a differentiator; it's table stakes, and the useful question has shifted from whether teams use it to what they use it for. That distinction turns out to matter more than the adoption rate itself.
The honesty finding is the one worth dwelling on. Teams that use AI for both goal-writing and mid-cycle analysis accept a low score on a missed goal only 14% of the time, against 35% for teams using AI only to write the goals. In other words, AI pointed at watching progress makes teams more honest about misses, while AI pointed only at drafting goals does little for the underlying discipline.
This maps onto the honesty statistics from earlier: what changes behaviour is goals that get watched, not goals that are better worded. AI that surfaces a drifting key result mid-cycle removes the option of letting it slide unnoticed, which is exactly the condition that makes gaming irrational.
The ROI of Getting Goals Right
The payoff for closing these gaps is measurable, and the spread between doing it well and doing it badly is larger than most teams assume.
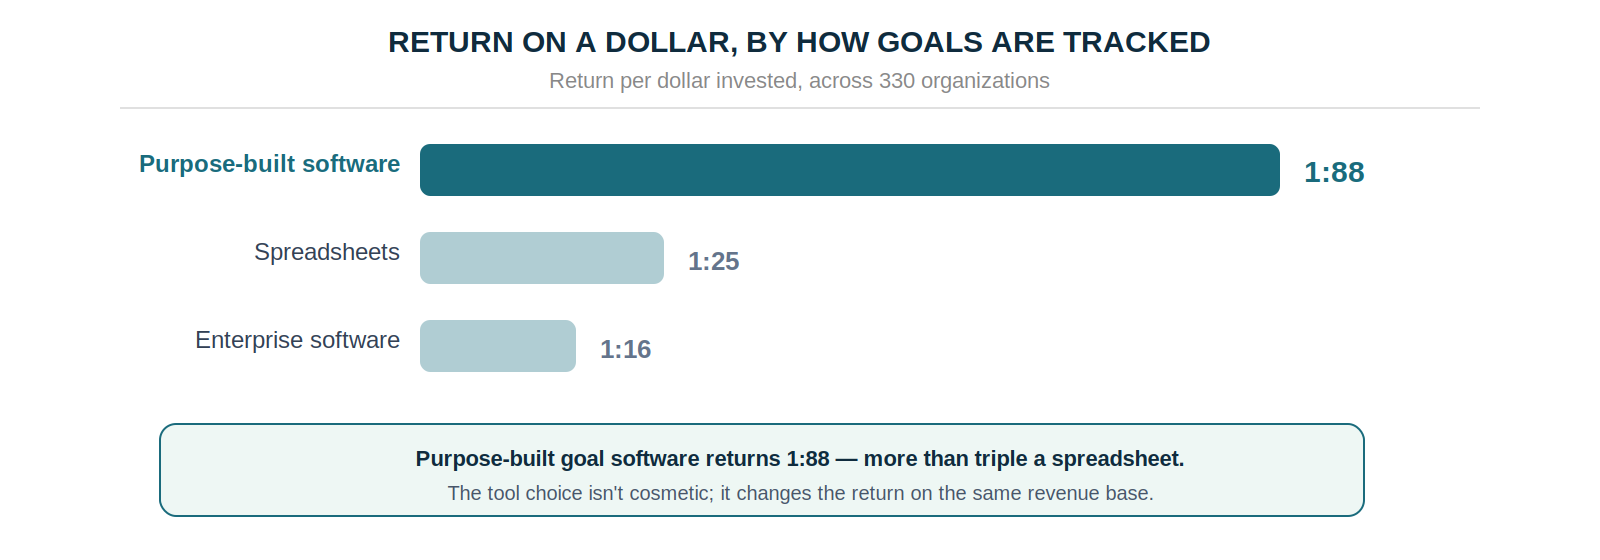
Across 330 organizations, goal setting generates a median 1:25 return on investment, rising to 1:88 for teams using purpose-built goal management software and falling to 1:16 on heavy enterprise systems (ROI of OKRs 2026 Benchmark Report). The counterintuitive part is that the most expensive option returns the least — enterprise platforms carry per-user costs and implementation overhead that eat into the return, while the discipline they add over a lighter tool is marginal.
The return is produced by the habits the earlier statistics describe, and those habits don't get more effective just because the tool is more expensive. Spend is not what buys the return.
The supporting figures show the returns are both broad and fast. 98% of organizations report measurable revenue growth from their goal process and 95% report reduced wasted work — near-universal, which suggests the upside isn't confined to a few high-performers but is available to almost any team that runs the process with discipline.
And 62% see a return within the first quarter, which matters for anyone weighing whether to bother: the payback lands inside the first cycle rather than years out. Taken together, the ROI data reframes the tool-and-process question from a cost to a return calculation — the money isn't the risk; running goals badly is.
What the Goal Setting Statistics Add Up To
Read together, these goal setting statistics tell one story about where goals come apart. The failure shows up in the weeks after the plan is set, not in the planning session. 86% can't name the strategy, half the goals have no owner, 60% of failing priorities are never cleanly resolved, and a third of people would notice nothing if their tracker vanished. The planning meeting was fine; the follow-through was where it came apart.
The fixes are the same few things every study points back to: connect goals to strategy, put one name on each, review them weekly, and close every cycle with an honest retrospective. Teams that do generate 1:88 on the effort; teams that don't generate a spreadsheet full of watermelons. The data has been remarkably consistent on which side of that line is worth being on.
Data: Strategy Execution Benchmark 2026 (180 strategy and operations leaders), OKRs Tool platform data (876 organizations, 20,952 key results), The 2026 OKR Benchmark Report (200 organizations), The ROI of OKRs 2026 Benchmark Report (330 organizations), OKR Intelligence Report 2026 (222 organizations), The State of Goal Management (210 full-time employees at growing companies) and the Goal-Setting Benchmark (280 operations and strategy leaders).