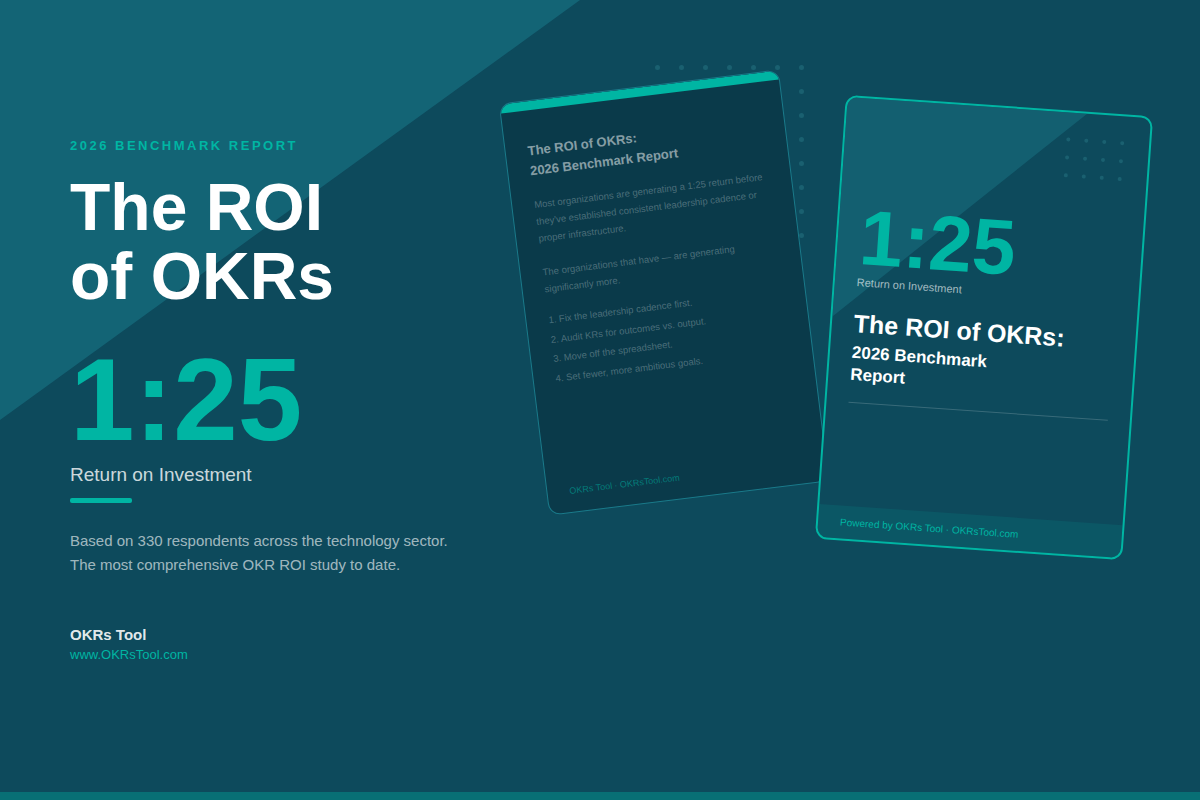
OKRs generate a 1:25 return on investment based on survey data from 330 technology sector organizations. Most organizations see measurable results within a single quarter, yet the majority are still leaving significant ROI on the table due to broken execution habits and spreadsheet-based infrastructure.
_______________________________________________________________________________________________________
For years, the business case for OKRs has lived in the realm of anecdote.
Leaders who'd read Measure What Matters believed in the framework. Consultants cited Google and Intel. But when a CFO asked "what's the return on this?" The answer was usually "we think it works."
We wanted a better answer.
So we surveyed 330 organizations across the technology sector - all active OKR users - to find out what OKRs are actually worth in revenue, operational efficiency, and measurable return on investment.
Here's what we found.
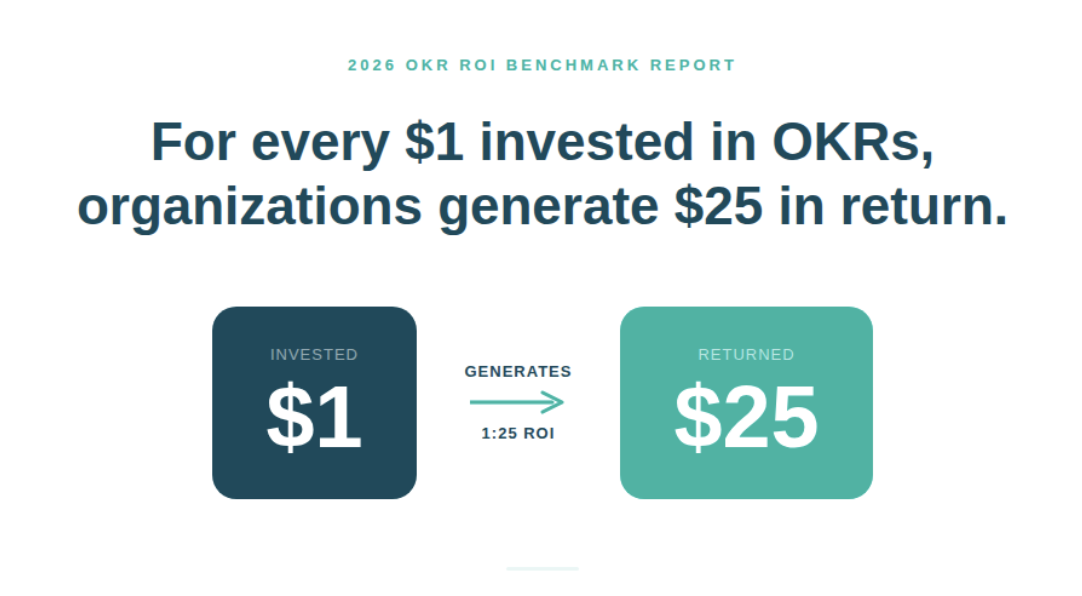
For Every $1 Invested in OKRs, Organizations Get $25 Back
Based on the median revenue growth reported by respondents - 15%, applied against a $10M revenue baseline and a $60K internal time cost - the modelled return on OKR investment is 1:25.
For organizations in the upper range of reported impact, that ratio climbs significantly higher.
This is a modelled estimate based on self-reported outcomes, not an audited figure. We've been deliberately transparent about the assumptions. But even at the conservative end of the model - 10% revenue growth, a 1:17 return - the business case is difficult to argue with.
Almost Every Organization Using OKRs Reports Measurable Impact
Of the 330 organizations in our survey, 98% reported measurable revenue growth impact from OKRs. 61% cited direct improvement in revenue growth rate. 95% reported a reduction in wasted or misaligned work. 86% reported shorter decision cycles.
Only 2% reported no measurable impact - a figure that points to execution failure, not framework failure.
Most Organizations See Results Within a Single Quarter
62% of organizations saw measurable impact within a single quarter. 13% within the first month. That reframes the conversation around risk.
The question most leadership teams ask before adopting OKRs is "how long before we see a return?" The data suggests the answer is the same quarter they start - which means the bigger risk isn't adoption. It's deferral.

The Execution Gap Is Where the Money Is Being Left
Here's the tension at the heart of this data.
If OKRs deliver a 1:25 return, why are most organizations still capturing only a fraction of it?
- It’s because 45% of teams have less than half their weekly work tied to an OKR.
- It’s because only 49% of leaders review OKRs consistently every week.
- It’s because 40% of organizations are still managing OKRs in Google Sheets or Excel - creating the illusion of a system without the substance of one.
The 1:25 return is being generated by organizations where the weekly habit is broken, alignment is partial, and the infrastructure is a spreadsheet. The upside from closing those gaps is substantial.

Spending More Time on OKRs Actually Makes Things Worse
The data shows that organizations spending more than 30 minutes per week on OKRs perform worse than those spending less.
It's counterintuitive until you recognize the pattern: when check-ins run long, they become performative. Updates replace decisions. Status replaces signal.
The highest-performing teams keep reviews under 30 minutes - structured around blockers and next steps, not reporting. More time on OKRs is not the answer. More intentional time is.
The 1:25 Return Is a Floor, Not a Ceiling
70% of organizations in this benchmark have completed fewer than five OKR cycles.
They are, by any measure, still early. The 1:25 return is not the ceiling - it's the floor. And the organizations closest to capturing the full return are the ones that have made OKRs an operational discipline rather than a quarterly ritual.
The median return is being generated despite inconsistent leadership cadence, partial work alignment, and spreadsheet-based infrastructure. As those execution gaps close — with more weekly work tied to OKRs, outcome-based key results, and consistent reviews — the economics compound quickly.
The upside isn’t theoretical; it sits in the discipline most teams haven’t fully built yet.
Get the Full 2026 OKR ROI Benchmark Report
The full report goes deeper - including the one finding most OKR advocates won't tell you (enterprise software generates a worse return than running OKRs on a spreadsheet), the complete ROI model with every assumption visible, and an action plan built entirely from what the highest-performing teams in this benchmark do differently.