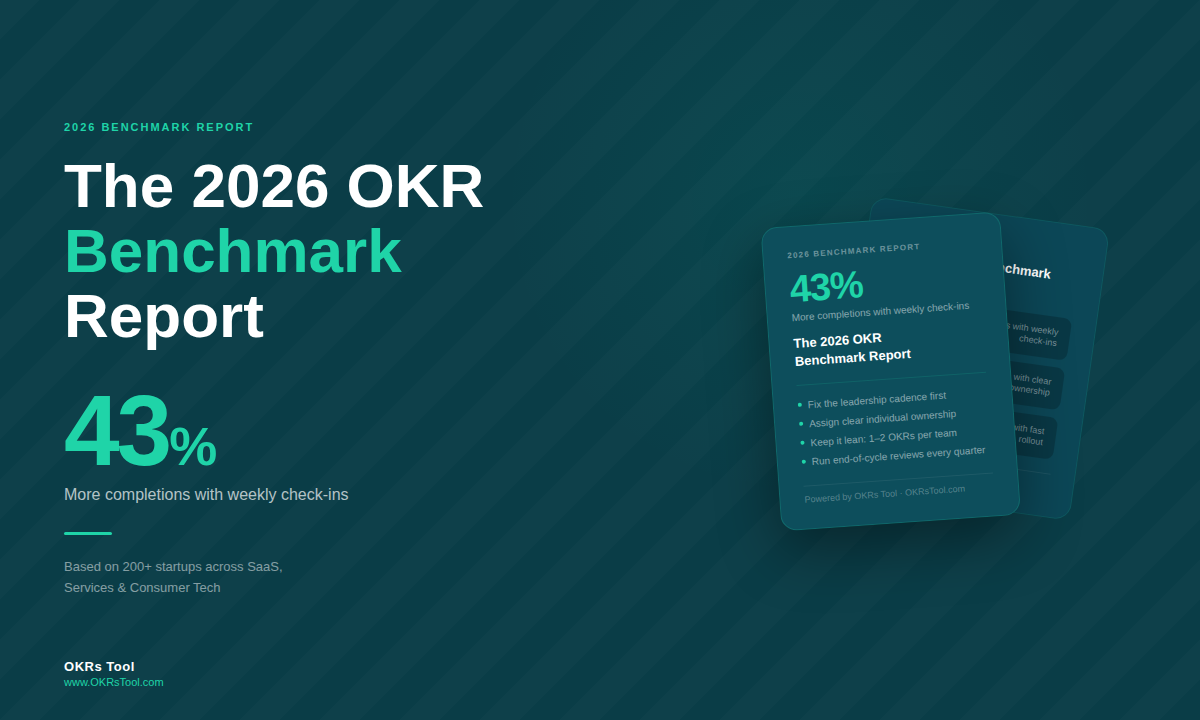
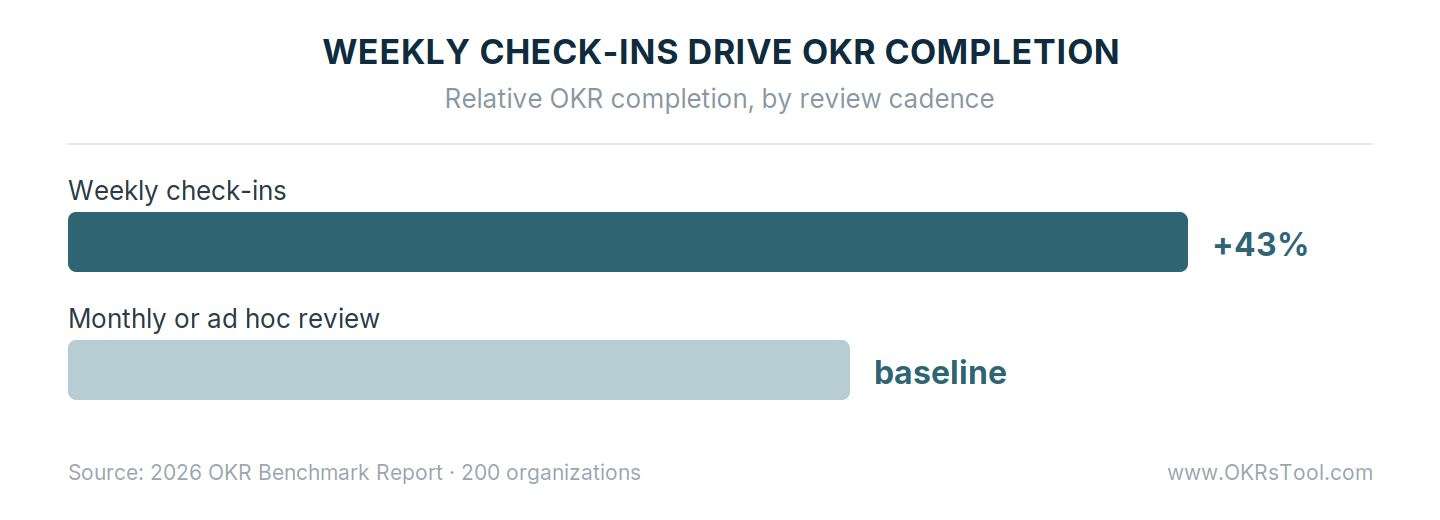
The 2026 OKR Benchmark Report analyzed 200 organizations to find what separates OKR programs that improve every quarter from those that stall after cycle one. The gap comes down to five habits — and the largest single one is cadence: teams that check in weekly complete 43% more OKRs than teams reviewing monthly or ad hoc.
The data comes from 200 operators, team leads, and department heads across growing organizations, examining what high-performing OKR programs do that stalled ones don't. The finding underneath all of it is that OKR success is behavioral, not a matter of writing better goals. The same five habits show up in the top performers again and again, and the teams that skip them abandon OKRs at three times the rate.
One structural finding is worth stating up front: inside growing companies, the primary drivers of OKR adoption are senior operators — VPs, heads of department, and team leads — not founders. As companies scale past the early stage, OKR accountability shifts to the operator layer, and the habits that work are built around the operator's cadence: quarterly cycles, weekly check-ins, and team-level ownership, rather than top-down founder mandates.
1. They Review Progress Weekly
Cadence is the single largest lever in the data. Teams that keep a weekly check-in habit complete 43% more OKRs than those reviewing monthly or ad hoc, and teams that skip the weekly rhythm entirely are three times more likely to abandon OKRs altogether.
The check-in doesn't need to be long. Fifteen to twenty minutes, the same time every week, focused on what moved, what's at risk, and where help is needed — the cadence matters more than the length. The consistency is what compounds: a goal touched every week stays in view and gets corrected early, while one reviewed monthly surfaces its problems too late to fix.
2. They Assign a Single Named Owner
Shared ownership sounds collaborative, and in practice it produces the most common OKR failure mode. Across growing organizations, 50% of all Key Results have no named owner at all.
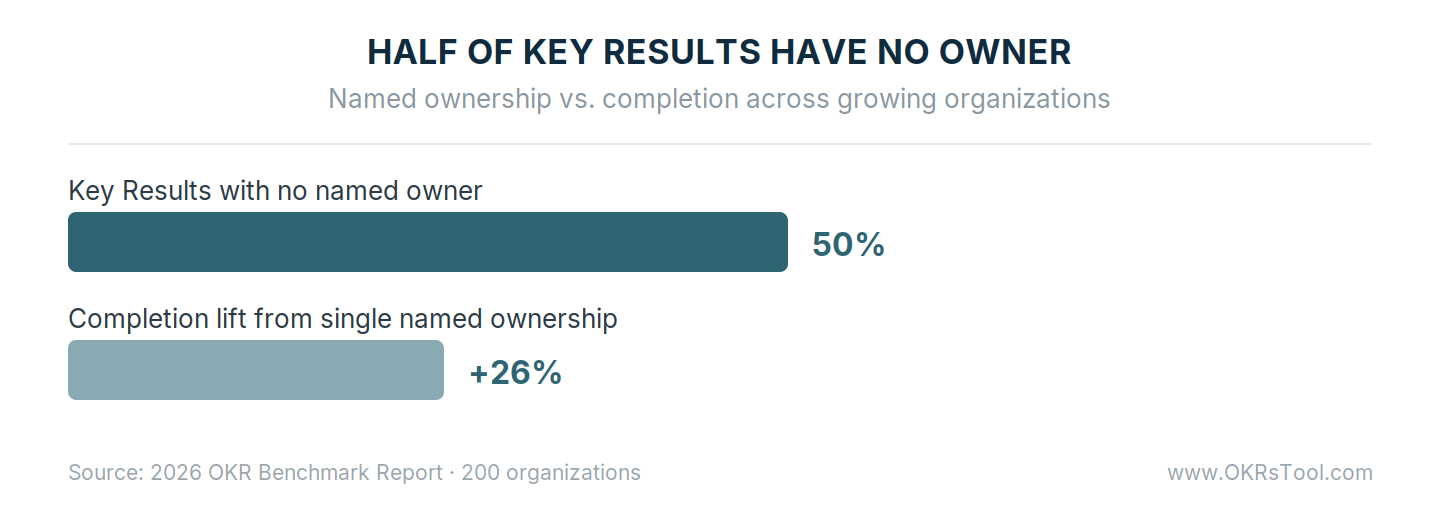
Teams where every Key Result has one clearly named owner complete 26% more than those with shared or vague ownership. The owner isn't a solo doer of all the work; their job is to ensure progress happens, and to be the single name against the number every week. A goal owned by everyone is owned by no one, and it's the first to go quiet.
3. They Launch Fast
Teams that spend weeks designing the perfect OKR system lose momentum before the first cycle starts. Teams that get their first cycle live in under a week complete up to 50% more goals than those with extended rollout timelines.
Speed of first move is one of the strongest predictors of first-cycle performance. The system evolves cycle over cycle; the first version only needs to be live, with OKRs written well enough to measure, not perfectly. Perfecting the OKRs before the quarter starts trades a small gain in quality for a large loss in momentum, and the data says momentum wins.
4. They Close Every Cycle With a Retrospective
The habit that compounds hardest is the one most teams skip. Teams that run structured end-of-cycle retrospectives complete 30–45% more OKRs the following quarter, because the retrospective is where the learning loop that improves the next cycle actually gets built.
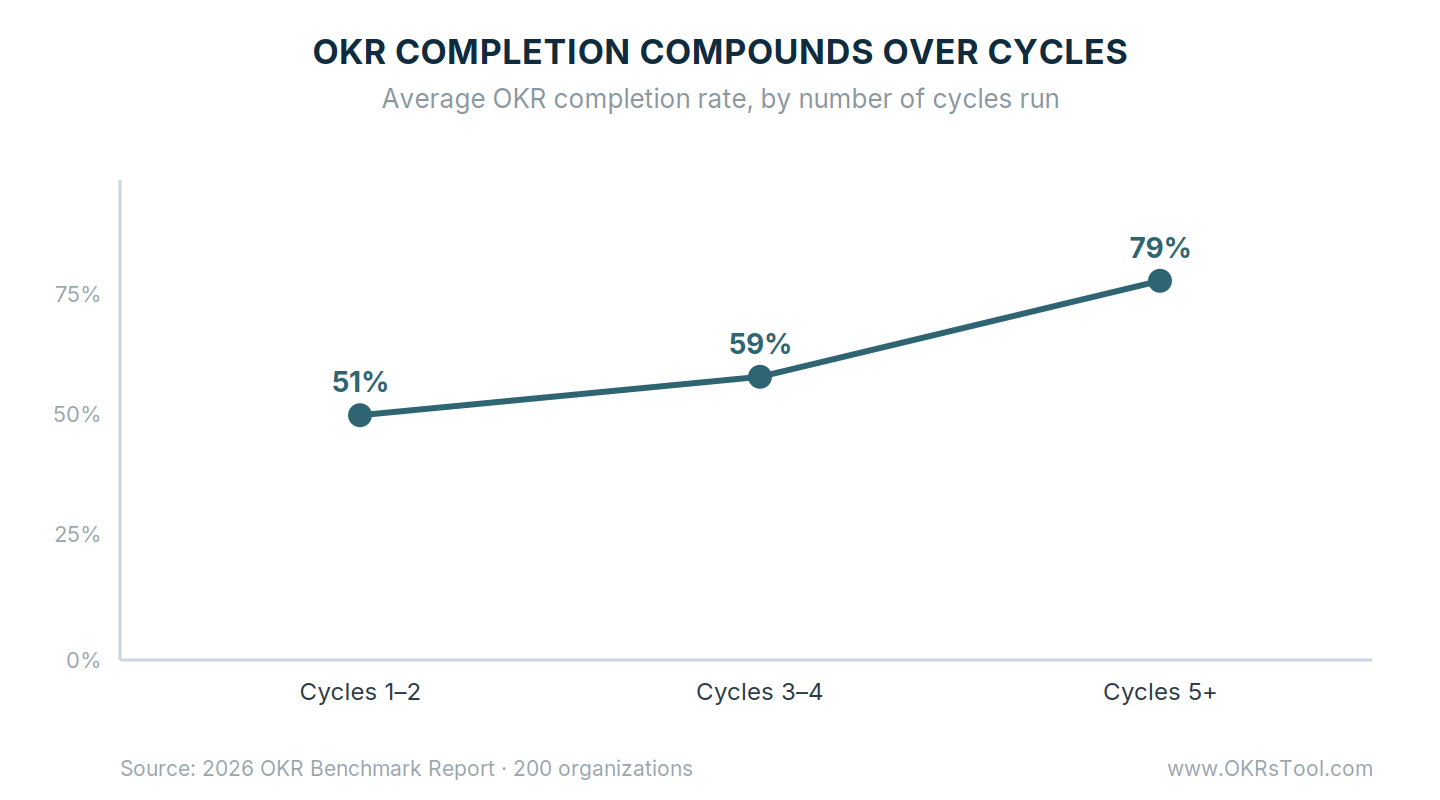
The OKR maturity curve is the evidence: completion averages 51% at cycles 1–2, 59% at cycles 3–4, and 79% at cycles 5 and beyond. That climb comes from accumulated discipline rather than selection or luck, and nearly all of it comes from the structural changes a team makes after honestly reviewing what went wrong. A team that never runs the retrospective never starts the climb.
5. They Connect Team Goals to Company Strategy
The most consistently cited problem in OKR programs is also one of the most fixable: 65% of teams admit their OKRs aren't directly linked to company goals. When the connection is missing, teams work hard on goals that don't add up to the company's strategy.
High-performing teams close the gap structurally, cascading OKRs from company to department to team, with an alignment map that makes every connection visible before the cycle starts.
Exhortation to "stay aligned" does nothing; what works is a structure — often a single platform — where a team can see which company priority its goals serve, and leadership can see which work is moving each priority.
From Findings to Practice
The five habits reinforce each other, which is why the top performers run all of them rather than picking one. Weekly check-ins surface drift; single ownership gives the drift a name; a fast launch gets the cycle running before momentum fades; the retrospective turns each cycle's lessons into the next cycle's improvements; and alignment makes sure the whole effort adds up to the company's strategy. Drop any one and the others weaken.
None of the five requires a better strategist or a bigger budget — they require a system that makes the habits the default rather than the exception. That gap separates an OKR program that survives past cycle one and compounds toward 79% completion from one that stalls at 51% and gets abandoned.
The full report breaks down the cadence benchmarks, ownership patterns, and rollout data behind each habit, alongside the scoring approach and team-level goals that carry the strategy down.
Data: The 2026 OKR Benchmark Report, a survey of 200 organizations on OKRs Tool.