
OKR completion averages 51% in the first two cycles, 59% in cycles three and four, and 79% by cycle five. Results improve steadily, yet trust in the process lags a cycle or two behind, which is why so many rollouts get dropped shortly before they pay off. Change management for OKRs means planning for that gap, quarter by quarter, before the first cycle starts.
Two quarters into an OKR rollout, the person running it sits down to prepare the leadership update. Completion came in around half, a few teams have stopped updating their key results, and someone in the last leadership meeting asked whether the old way was simpler. Nothing has gone badly wrong, and the rollout is still at the point where many get shelved.
Data from four studies explains why. OKR results improve faster than people's belief in them, and the gap between the two is where rollouts get dropped. The person accountable for the rollout can plan for that gap quarter by quarter, starting before the first cycle, and the free playbook below turns the plan into checklists and a leadership script.
Why OKR Rollouts Stall Even When Results Improve
The first obstacle comes before the rollout starts, when the case for OKR adoption has to be made. In the Goal-Setting Benchmark, a survey of 280 operations and strategy leaders at companies of 50–200 people, 21% already use OKRs and 27% are considering them, while 22% considered OKRs and decided against them.
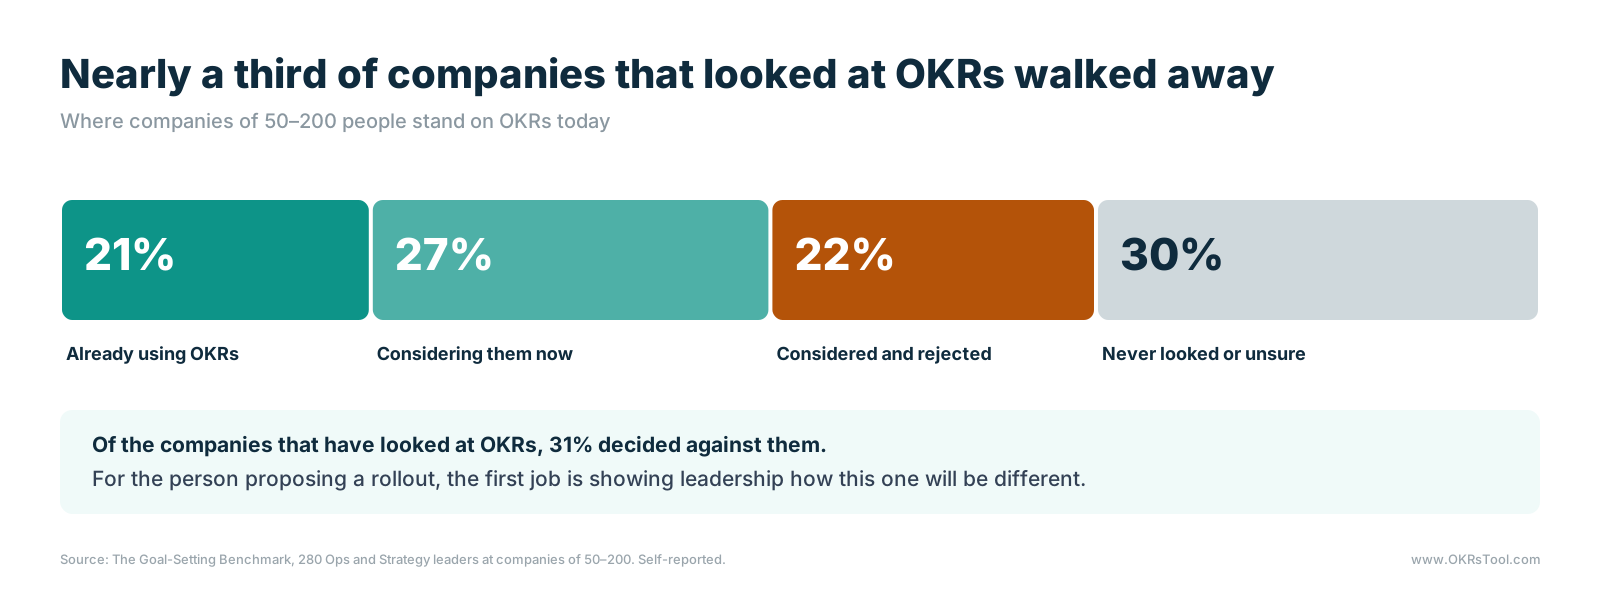
Of the companies that have looked at OKRs, nearly a third walked away, so the person proposing a rollout often faces a leadership team with an opinion already formed or a peer who tried OKRs elsewhere and gave up. A plan that shows how this rollout will handle the hard parts is more persuasive than enthusiasm for the framework, and the common objections to OKRs are worth answering before anyone raises them.
The second obstacle is the lag between results and belief. In the Growing Pains of OKRs study, 24% of startups rated their trust in the OKR process at the top of the scale, against 40% at companies of 50–200 people that had run more cycles. Trust builds with repetition, so a team in its first or second cycle is being asked to keep going before it has seen the evidence that would convince it.
The third obstacle is cultural. The State of Goal Management found that 92% of employees admit to at least one form of goal-gaming, and 70% have reported a goal as healthier than they knew it to be. When goals affect performance ratings, 96% admit to sandbagging, against 81% when goals are kept separate. A rollout that ties OKRs to pay in its first year gives people a reason to set safe targets and report green, which undermines the program at the moment it most needs accurate numbers.
Results by Cycle, and What the Team Feels
The OKR Benchmark Report tracks average completion by how many cycles a company has run, and the climb is steady.
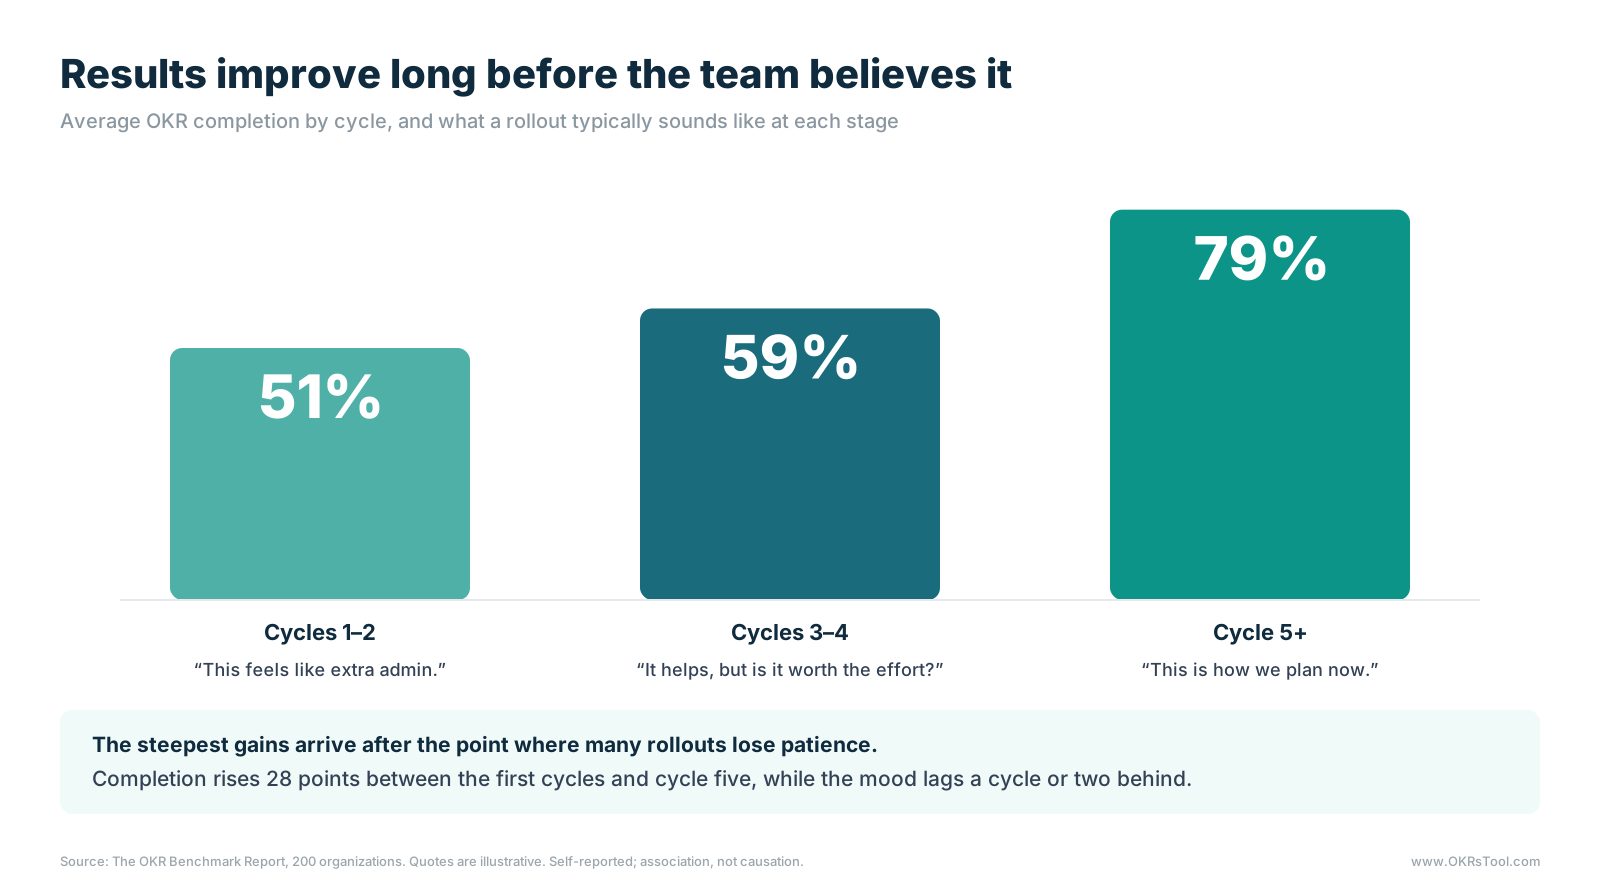
Cycles one and two: 51%. The team is learning the habit while running it, much as any first OKR cycle does. Key results are often written as tasks, check-ins feel like an extra meeting, and the first scores land around half. The champion's job here is to protect the weekly rhythm and set expectations, because the numbers are doing what first cycles usually do.
Cycles three and four: 59%. Goals are sharper and the rhythm is familiar, but the payoff still feels modest compared with the effort, and this is where patience runs thinnest. The champion's job is to show the trend, fix what the retrospectives surfaced and widen the rollout carefully.
Cycle five and beyond: 79%. OKRs have become the way the company plans. The end-of-quarter score rarely surprises anyone, because the team has watched it move every week. Teams that reach this stage on the OKR maturity curve got there by running more cycles, which means the first year's main task is keeping the rollout alive long enough to arrive.
The Three Moments a Rollout Is Most Likely to Be Dropped
Rollouts usually lose momentum at predictable points, and each one has warning signs a champion can watch for.

1. The Weekly Check-In Slips
Teams that skip check-ins are three times more likely to abandon OKRs altogether, according to the OKR Benchmark Report. The slip starts small: the check-in moves once for a busy week, updates start arriving in a burst before reviews, and within a month half the owners have stopped updating. Moving the weekly check-in into Slack or Microsoft Teams, where it reaches people without anyone chasing, and tracking the share of owners updating each week turns the slip into something visible early.
2. The Results Look Flat at the End of Cycle Two
Average completion in cycles one and two is 51%, and it's the moment leadership is most likely to ask whether OKRs are working. The retrospective can turn into a debate about the framework instead of a review of the goals. The defense is preparation: tell leadership before cycle one ends what completion usually looks like early on, and report leading indicators next to the score so progress is visible even when completion hasn't moved much yet.
3. Goals Stop Linking Up at the Next Planning Round
In the Growing Pains study, companies where OKRs clearly linked to company goals hit their goals very consistently 68% of the time, against 19% where only some linked up, and 93% of companies where very few OKRs linked up reported abandoning OKRs. The risk peaks at the planning round after a disappointing cycle, when teams draft goals before company objectives are published and the link gets skipped. Publishing company-wide OKRs first and making a named parent objective a condition of approval keeps every team goal connected.
A Change Plan by Quarter
The plan below gives each quarter of the first year one goal, a short set of actions and a measure that shows whether it's working.
Two habits from the benchmark data shape the first quarter more than any others. Teams running one or two objectives per quarter are twice as likely to achieve them as teams running three or more, and teams with a single owner on every key result complete 26% more of their goals. Starting small with a pilot group gives the rest of the company working examples to copy in the third quarter.
The end-of-cycle reflection is what turns each quarter into the next one. Teams that run structured retrospectives complete 30–45% more OKRs the following cycle, which makes the retro the most direct lever a champion has on the maturity curve.
What to Tell Leadership When Cycle Two Disappoints
The cycle-two leadership update decides whether the rollout gets two more cycles, and it works best when it covers four things in order.
Where we are. State the completion rate for both cycles and set it against the benchmark: 51% is typical for cycles one and two, rising to 59% in cycles three and four and 79% by cycle five. Placing the company's own number on that curve changes the conversation from "is this working?" to "are we on track for where companies usually get to?"
What's working. Report the leading indicators that move before completion does: the share of owners checking in every week, the share of key results with one named owner, the share of team objectives linked to a company objective, and the share of key results still at zero at the mid-quarter review. These show whether the habits are forming, and the habits are what produce the later results.
What we're changing. List the three or four specific changes from the retrospective. Leadership is far more willing to extend a rollout that is visibly learning than one asking for patience.
What I need from you. Ask for two more cycles at the current scope, company objectives published before team planning starts, and OKRs kept separate from bonuses and performance reviews this year. Each request maps to one of the three danger moments, which makes it easy for leadership to see why it matters.
Plan for the Gap Before Cycle One
OKR change management comes down to a timing problem. Results improve from 51% to 79% over five cycles, while trust follows a cycle or two behind, and the rollouts that get dropped are usually the ones whose champion had no plan for that gap. Setting expectations early, protecting the weekly check-in, keeping goals linked to company objectives and reporting leading indicators alongside completion give a rollout the time it needs to reach the cycles where it pays off.
For the OKR champion, most of that plan is weekly upkeep, and upkeep is where rollouts slip. A platform that sends every owner a weekly check-in, requires an owner on each key result and keeps the alignment map live does much of the remembering, so the champion can spend the first year on the conversations that keep the rollout funded.
Data: The OKR Benchmark Report, Growing Pains of OKRs, The Goal-Setting Benchmark and The State of Goal Management.