Only 7% of strategy and operations leaders say most of their company's work ladders up to strategy, and 86% say their workforce can't name the top priorities. Alignment usually gets judged by feel in a leadership meeting, yet it can be measured with three numbers a COO can report to the board every quarter, and the data on what happens when those numbers slip is hard to ignore.
Ask a leadership team whether the company is aligned and the answer is almost always yes. Ask the same question a different way, by checking how many team goals connect to a company goal, how many people can name the priorities, and how many initiatives are running twice, and the answer changes. The gap between those two answers is where strategy gets lost between the planning offsite and the work that fills an ordinary week.
This guide brings together four studies on how strategy travels inside companies of 50–200 people: the Strategy Execution Benchmark, the Growing Pains of OKRs study, the Goal-Setting Benchmark and the OKR Intelligence Report. It covers what strategic alignment looks like as a number, three metrics leadership can track every quarter, what weak alignment costs, and how to fix it at the start of a cycle, when fixing it is cheapest.
What Strategic Alignment Looks Like When You Measure It
Strategic alignment is the degree to which the work people do each week connects to the priorities leadership has set. It's usually described as a feeling, and the Strategy Execution Benchmark suggests that feeling is generous.
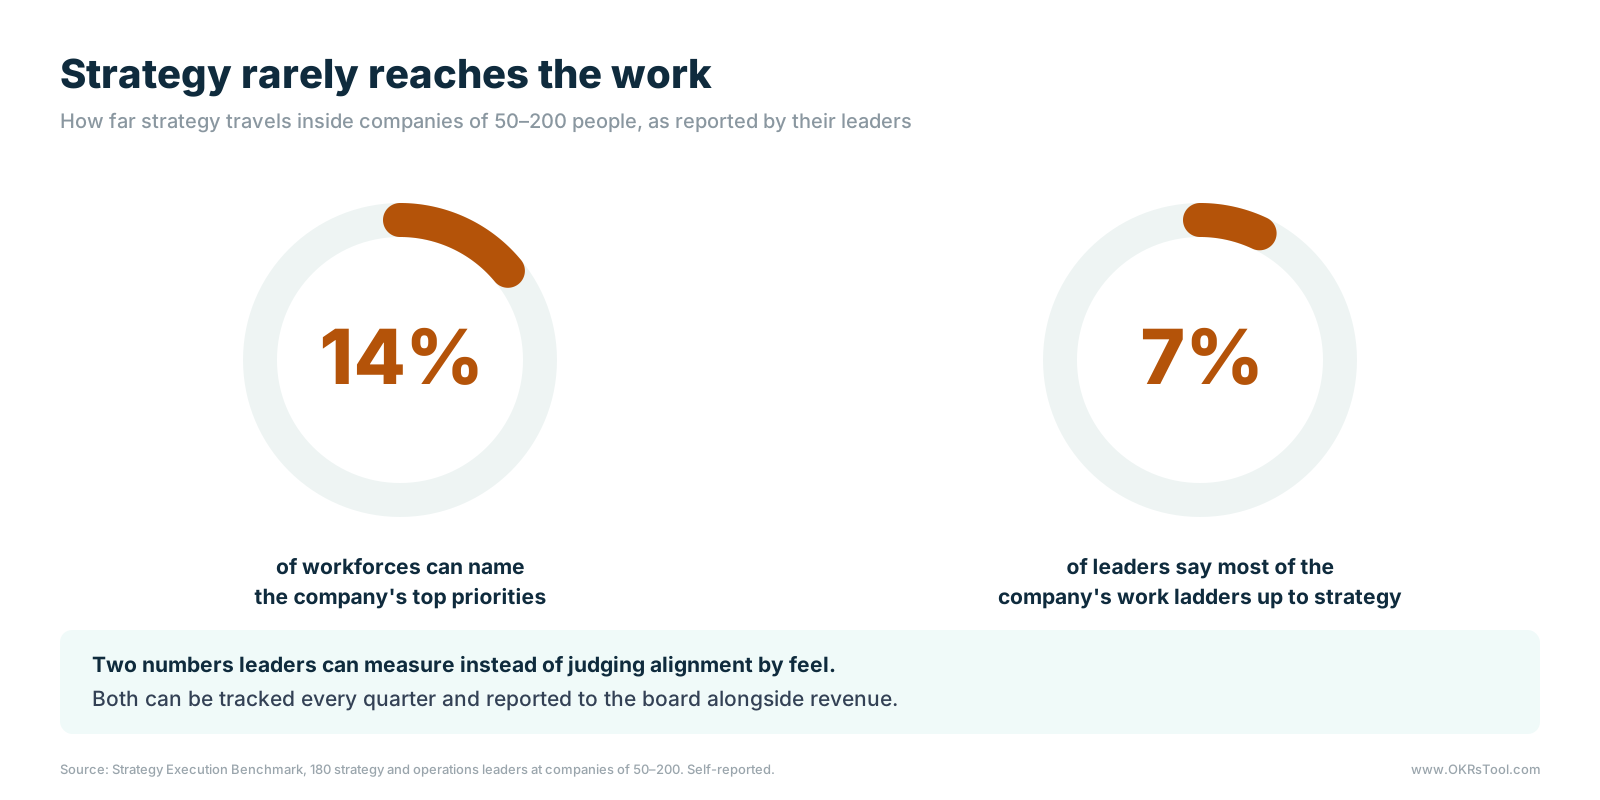
In that survey of 180 strategy and operations leaders, 86% said their workforce couldn't name the company's top priorities, leaving 14% that could. Only 7% said most of their company's work ladders up to strategy.
Those two figures describe the two halves of alignment: whether people know what the strategy is, and whether their work is connected to it. A company can do well on the first and badly on the second, with people who can recite the priorities and still spend their weeks on projects that serve none of them.
The same benchmark found that 61% of companies run strategy on spreadsheets, documents or nothing at all, which helps explain the gap. When the priorities live in a slide deck and the work lives in a project tool, nobody can see the connection between them, so nobody can measure it.
The first step toward alignment is putting the strategy and the goals beneath it somewhere the link between them is visible, such as an alignment map that shows every team goal against the company objective it serves. For a leadership team, the useful shift is to stop asking whether the company feels aligned and start asking how many goals, people and initiatives are connected to the strategic pillars, because each of those can be counted.
Why Alignment Decides Whether OKRs Survive
The case for measuring alignment gets stronger once you see what it does to results. The Growing Pains of OKRs study of 420 companies of 50–200 people compared outcomes by how many of a company's OKRs clearly linked to company goals.
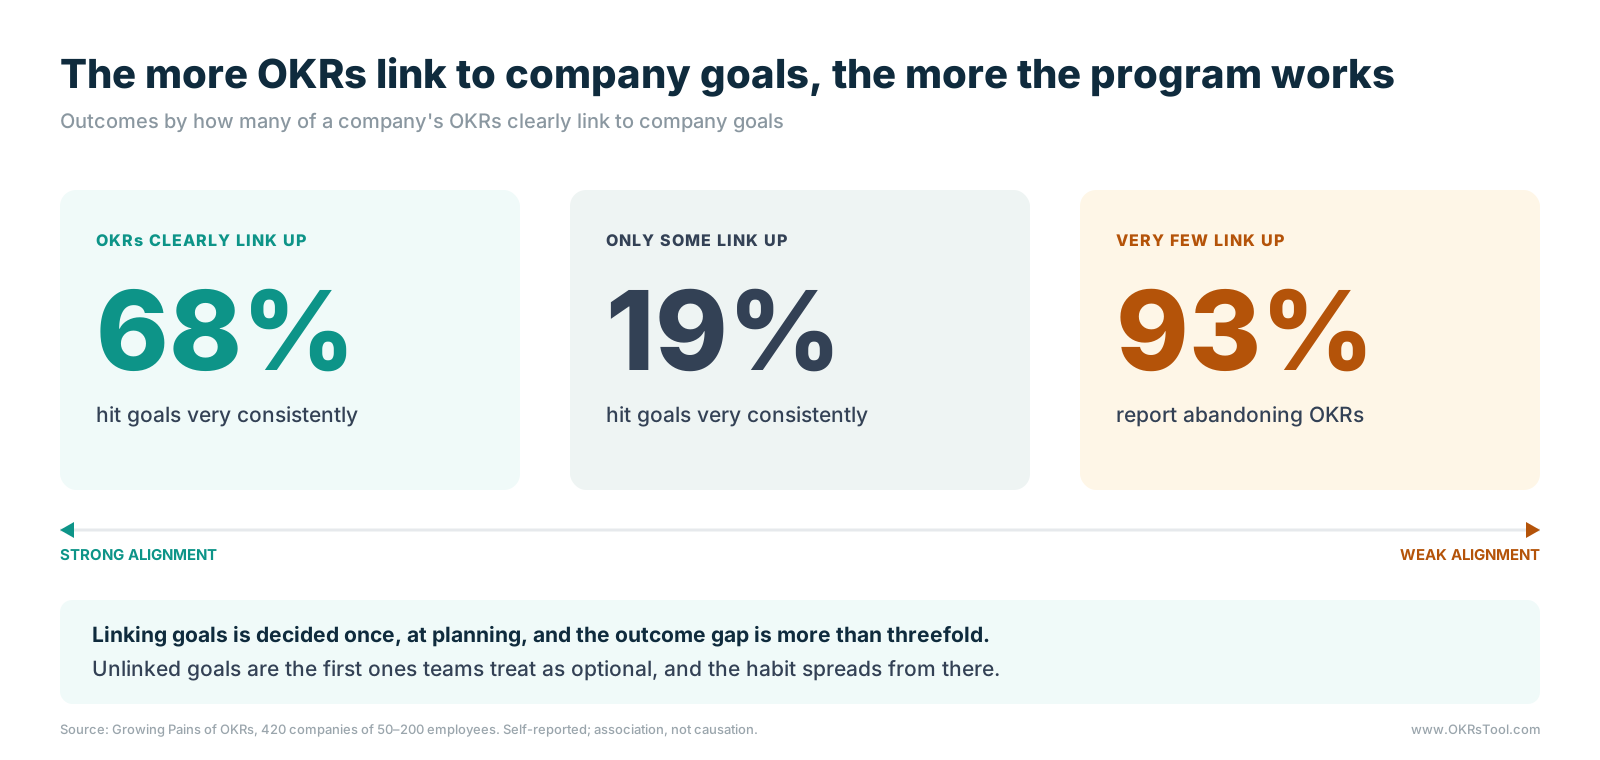
Where OKRs clearly linked up, 68% of companies hit their goals very consistently. Where only some linked up, 19% did. And among companies where very few OKRs linked up, 93% reported abandoning OKRs. The outcome gap between the first two groups is more than threefold, and the decision that creates it is made once, during planning.
The abandonment figure explains why alignment matters to the person responsible for the OKR program as much as to the CEO. A team goal that can't be connected to a company priority is the first one people treat as optional, because it can't be defended in a trade-off against work that clearly matters.
Once a few teams start treating their goals that way, the habit spreads, and the program unravels from the edges. Misalignment rarely announces itself, which is the strongest argument for measuring it before it shows up in the abandonment numbers.
Three Alignment Metrics Leadership Can Track
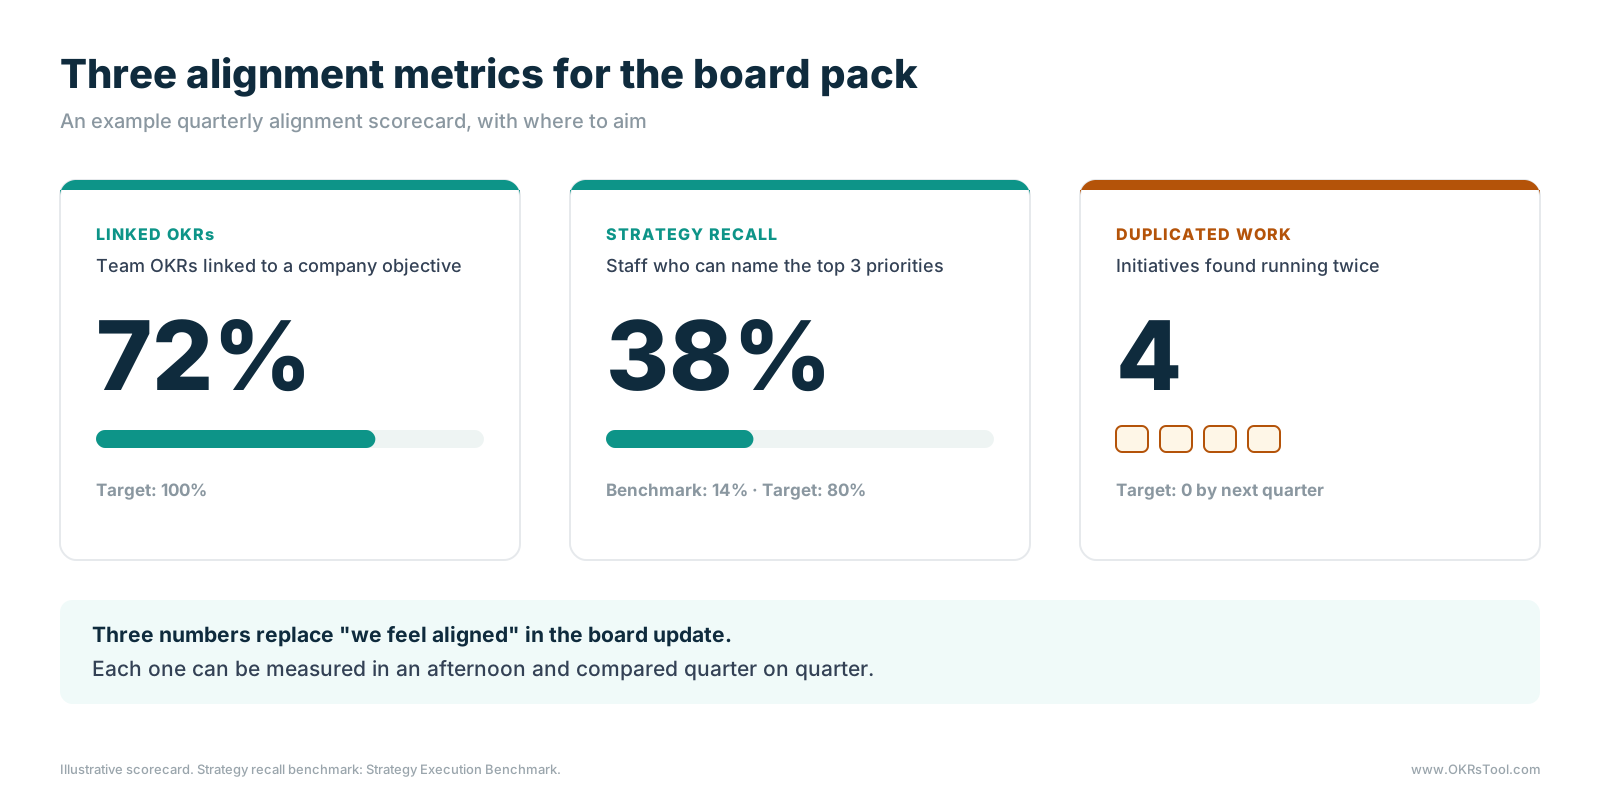
Three metrics cover the ground between the strategy and the work. Each takes an afternoon to measure, and together they replace "we feel aligned" with numbers that can be compared quarter on quarter.
1. Share of Team OKRs Linked to a Company Objective
Count the team-level objectives for the quarter and the number that name the specific company objective they serve. The target is 100%, because every team objective should be able to state its parent in one sentence. This is the metric most directly tied to OKR alignment and to the Growing Pains findings, and it's the easiest to measure when goals sit in one system where rolling OKRs up to company objectives is built in. A team objective that can't name a parent gets rewritten or cut during planning.
2. Share of Staff Who Can Name the Top Priorities
Run a short anonymous pulse survey each quarter asking people to name the company's top three priorities without prompting, and score how many get them right. The benchmark from the Strategy Execution Benchmark is 14%, which makes anything above it a sign of real progress, and a reasonable target for a company running OKRs well is 80%. The reasons employees can't name the strategy are usually too many priorities and too little repetition, so a low score often points at the length of the list as much as the quality of the communication.
3. Duplicated Initiatives
Ask each team lead to list the initiatives running under their OKRs, then look for overlaps: two teams building the same tool, researching the same customer segment or solving the same problem from different directions. Count the overlaps found and aim for zero by the following quarter. This metric catches the alignment failure the other two can miss, where every goal links up correctly and two teams still end up doing the same work because neither can see the other's initiatives.
The table sets out how to measure each metric and how often.
For a COO, these three numbers belong in the quarterly board pack next to revenue and headcount. They turn a vague claim into something a board can track over time, and they make it obvious when the strategy has stopped reaching the teams expected to deliver it, which is the kind of update that makes board meetings about decisions.
What Weak Alignment Costs
Weak alignment shows up first as hours and rework, well before it reaches the results, which is useful because hours and rework can be counted.
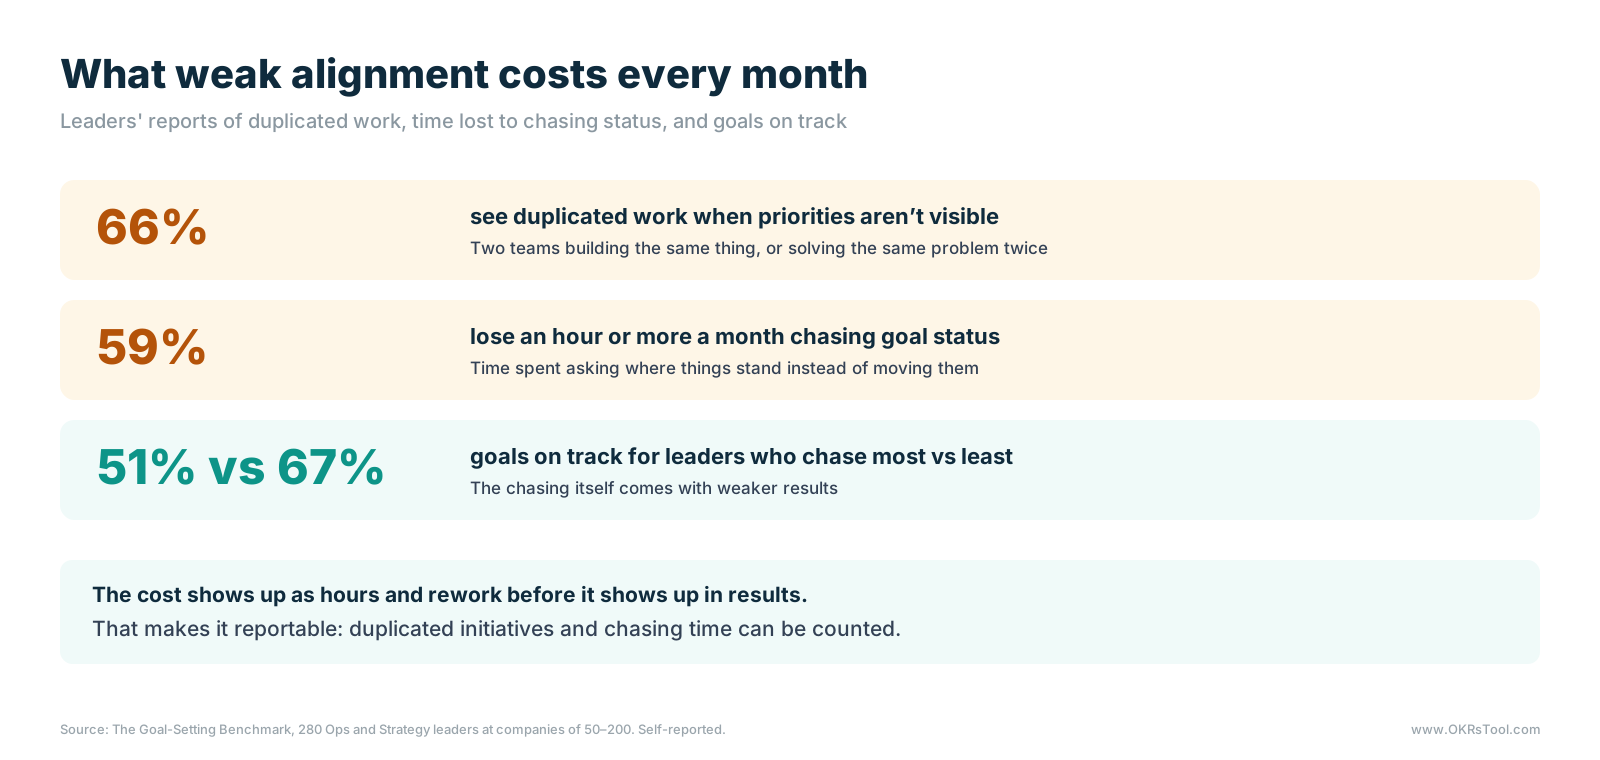
In the Goal-Setting Benchmark, a survey of 280 operations and strategy leaders, 66% said they see duplicated work when priorities aren't visible. Duplication is the most direct cost of weak alignment: two teams spending a quarter on the same problem means one team's quarter produced nothing new.
The second cost is the time spent finding out what's happening. 59% of the same leaders lose an hour or more a month chasing goal status, and the chasing comes with weaker results, since leaders who chase most reported 51% of goals on track against 67% for those who chase least.
When goals and their connections to strategy are visible to everyone, nobody needs to ask where things stand, and the leaders doing the asking get their time back. The Strategy Execution Benchmark adds the slowest cost of all: 83% of leaders get no automatic signal when a priority drifts, so misalignment can run for weeks before anyone with the authority to fix it notices, and 21% only find out a month or more after a priority went off track.
Fix Alignment at Planning Time
Alignment is cheapest to fix before the quarter starts. Once teams have committed to goals and started work, rewiring them to the strategy means stopping projects people have invested in, so the most effective alignment work happens during planning week.
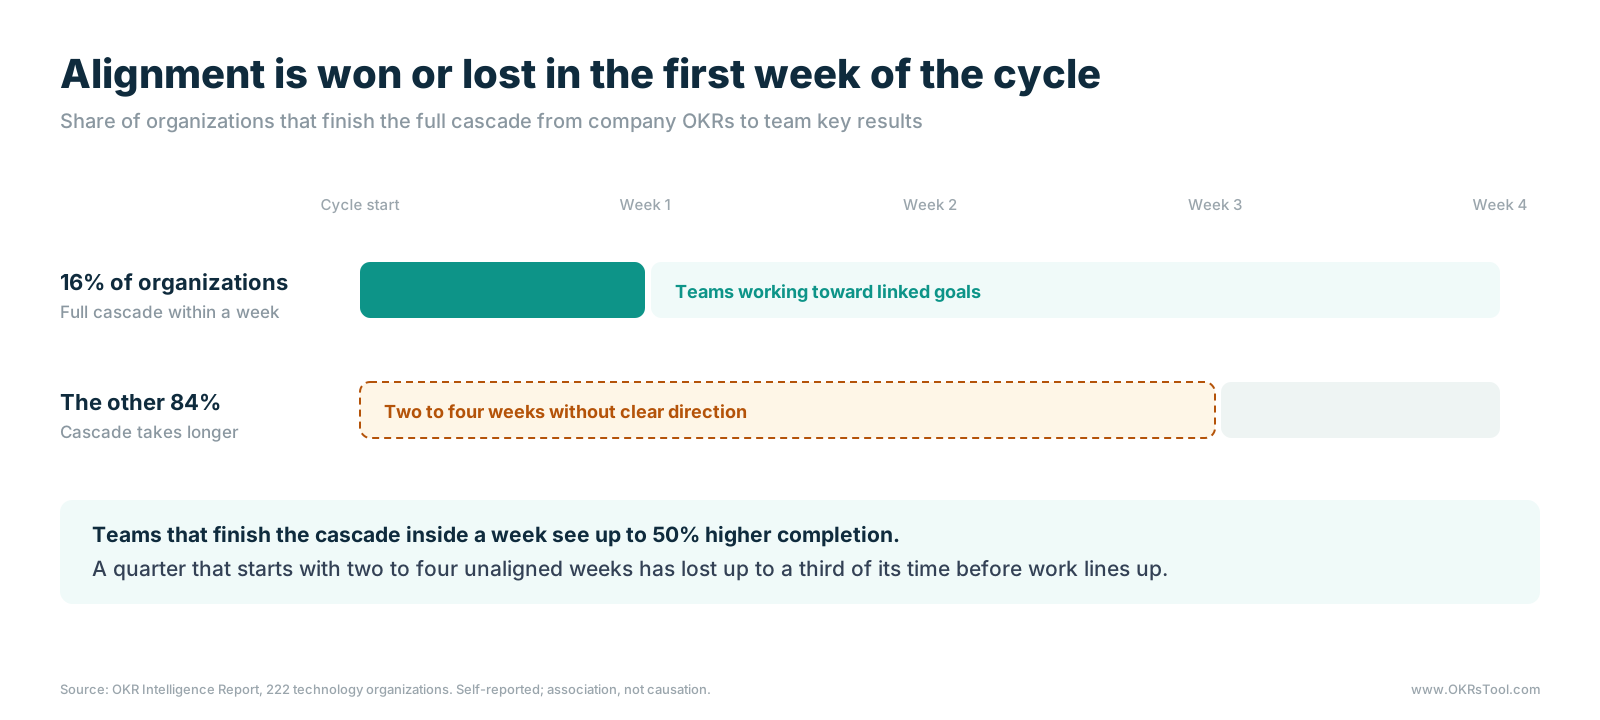
The OKR Intelligence Report found that only 16% of organizations complete the full cascade from company OKRs to team key results within a week. The other 84% spend the first two to four weeks of the cycle without clear direction, and teams that finish the cascade inside a week see up to 50% higher completion than those taking three to four weeks. A quarter that starts with a month of unaligned work has lost up to a third of its time before the work lines up behind the strategy.
Four planning habits close most of the gap:
Publish company objectives first. Teams can only link to company-wide OKRs that exist, so leadership finalizes the company objectives before teams start drafting.
Require a named parent for every team objective. The one-sentence link to a company objective is a condition of approval, checked before the cycle goes live, and the same review confirms a single owner on every key result.
Keep the priority list short. Fewer company strategic goals make every link clearer and every priority easier to remember, which is the core of ruthless prioritization. A list that only grows makes all three alignment metrics worse.
Compare initiatives across teams before the cycle starts. A thirty-minute review of each team's planned initiatives catches the duplicates that would otherwise surface halfway through the quarter, which is when they're most expensive to unwind. Cross-department OKRs are the natural answer when two teams turn out to be chasing the same outcome.
Report Alignment Like a Business Metric
Strategic alignment becomes manageable once it's measured. The four studies point to the same conclusion: the strategy reaches very few people and even less of the work, linked goals produce far better results and keep OKR programs alive, and weak alignment costs hours and rework every month before it costs a quarter.
For the person accountable for strategy execution, the practical step is to put three numbers in front of leadership every quarter: the share of team OKRs linked to a company objective, the share of people who can name the priorities, and the count of duplicated initiatives.
Measured at the end of each planning week and reviewed at the mid-quarter review, they show whether the strategy is reaching the work while there's still time to correct course. A platform that connects every team goal to the company strategy and shows the links in one view makes the first metric automatic and the other two far easier to act on.
Data: Strategy Execution Benchmark, Growing Pains of OKRs, The Goal-Setting Benchmark and the OKR Intelligence Report.