
In the top quartile of organizations on OKRs Tool, a median of 8% of key results are left at zero for the whole cycle. In the bottom quartile, the figure is 56%. That 7x gap is the largest of five findings from 29,987 key results, alongside what deadlines, descriptive writing, downgrades and early finishes reveal about the teams that hit their goals.
Pull up the end-of-quarter board at a team that struggles with OKRs and a few key results show real progress, a few are partway there, and a long tail sits at exactly 0%, untouched since planning week. Boards at the teams that hit their goals look different in ways that are easy to measure once you have enough of them.
We analyzed 29,987 key results from 3,527 organizations on the OKRs Tool platform to find where the two differ. Each of the five findings below was checked against its most obvious alternative explanation, and two popular ideas that failed those checks were dropped. What's left comes with the number behind it and what it means for the person running OKRs.
1. Winning Teams Abandon 1 in 12 Key Results. Losing Teams Abandon More Than Half.
We split organizations with four or more objectives into quartiles by hit rate and measured how many of their key results were left at zero for the entire cycle.
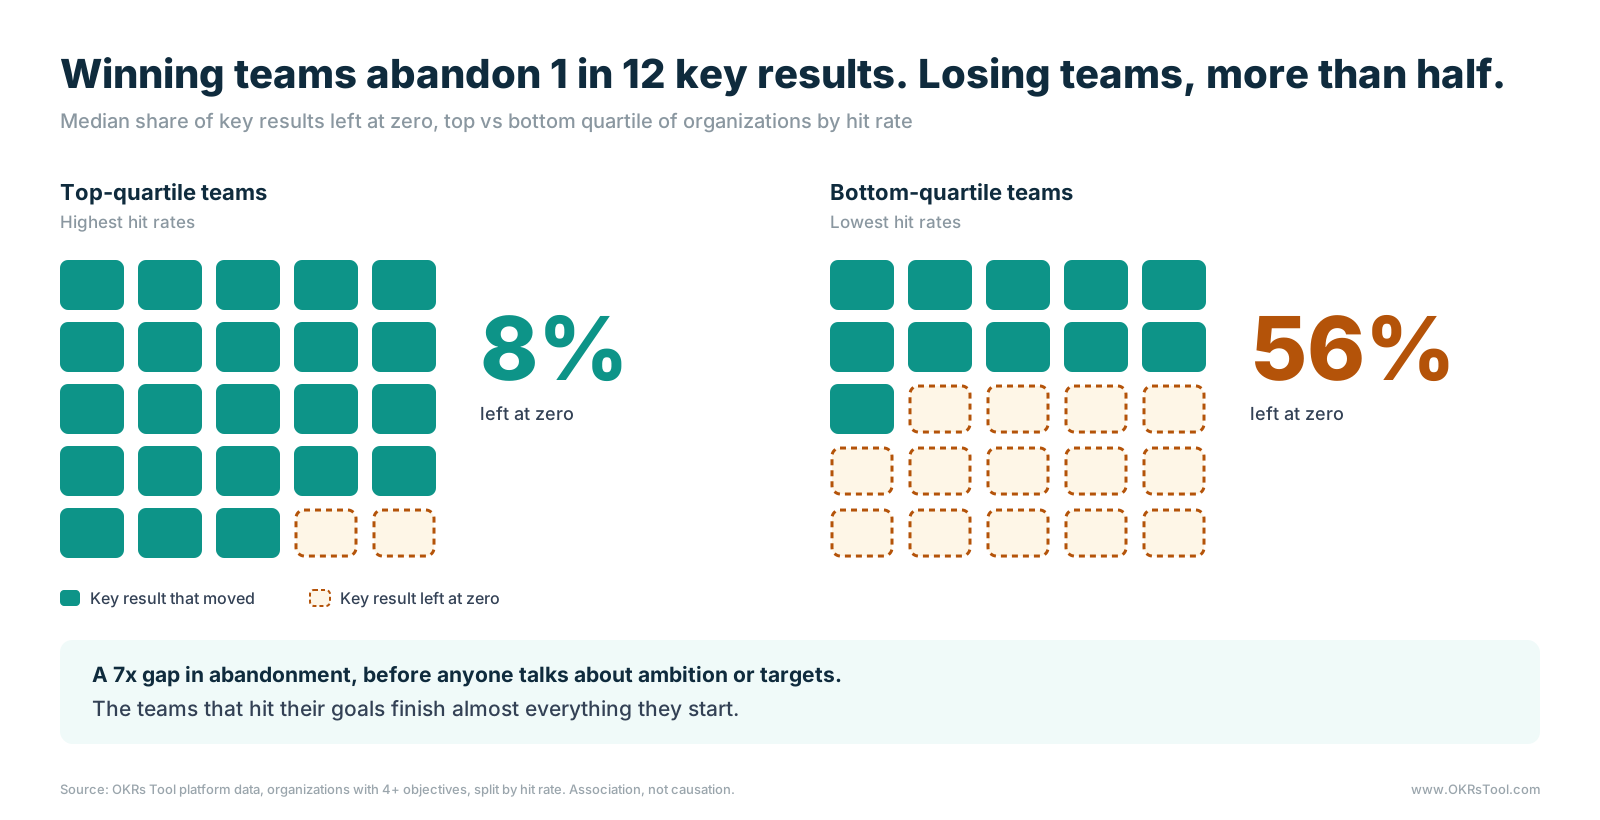
In the top quartile, a median of 8% of key results never moved off zero. In the bottom quartile, 56% never moved, more than half of everything those teams set. The teams with the best completion rates are the ones least likely to leave a goal behind once it's written.
An abandoned key result costs more than its own miss. It still sits on the board, still counts in the completion rate and still shows up red at the quarterly review, so a team that abandons half its list reports a weak quarter to leadership however well the other half went. After a few quarters like that, OKR programs die. Setting fewer OKRs, giving each one a named owner and closing unwanted ones with a written reason all make abandonment harder.
2. Teams That Hit Their Goals Write More Descriptive Key Results
The hit rate climbs steadily with the number of words in a key result, with no plateau and no reversal. Key results of one to three words hit their target 35% of the time, rising to 45% at four to six words, 47% at seven to ten, 58% at eleven to fifteen and 69% at sixteen words or more. Teams that hit write a median of 14 words, against 10 for teams that miss, and the climb holds when yes/no key results are excluded.
Length is the fingerprint here, and the cause sits upstream of it. "Grow revenue" is a wish, while a 15-word key result is the work of someone who decided what they mean, how it will be measured and by when. The difference also sits mostly between companies: within the same organization, longer key results did only slightly better than shorter ones.
Descriptive key results mark a team that thinks carefully about what it commits to, and padding a key result with extra words won't change its odds.
3. Key Results With a Deadline Hit 67% of the Time
When we broke key results into the elements of the classic template, only one of them showed up in the results. Key results with an explicit timeframe hit their target 67% of the time, against 51% for those without one.
The other elements made little or no difference. Key results containing a number hit 56% of the time, against 58% without one, and a from→to baseline gave no lift. Key results with a number, a baseline and a timeframe together hit at almost exactly the same rate as those with none of the three, so stacking template elements did nothing on its own. The practical lesson for writing OKRs is narrower than the usual formula and more reliable: give every key result a date someone can be held to.
4. Half of Key Results Get Revised Downward, With Almost No Penalty
Teams often avoid moving a number backwards in their OKR tracking, because a progress bar going the wrong way feels like failure. The data says the fear is misplaced.

Among key results with eight or more weeks of update history, 46% had at least one update that moved progress backwards. Those key results hit their target 68% of the time, against 72% for key results whose progress only ever went up. A downgrade means someone looked at the key result, found the old number was wrong and fixed it, which is how a watermelon OKR gets caught. Making downgrades normal in every check-in keeps owners reporting the real number.
5. 43% of Winning Key Results Finish in the First Half of the Cycle
A common piece of OKR advice says that a key result hit at 100% was set too low. Among key results that hit their target, 43% reached their final value in the first half of the cycle and held it from there, which fits the pacing benchmark finding that winning key results are typically at 50% by week four.
This describes winners more than it prescribes a tactic, since "finish early" isn't something a team can simply decide to do. Its use is in how early completion gets read. Before calling a key result sandbagged, check whether the team front-loaded the work, because that's the normal shape of a goal that lands. Stretch goals still have their place, labeled as stretch from the start.
The Five Findings at a Glance
The table puts each finding next to the number behind it and the action it points to.
What the Data Says About Running OKRs
Taken together, the five findings describe follow-through more than goal-writing. The teams that hit their goals set a list they intend to finish, write each key result carefully enough to know when it's done, put a date on it, correct the numbers as they go and close what no longer fits.
For the person accountable for OKRs, abandonment is the number to watch first. A key result still at zero after the first few check-ins needs an owner, a first step or a decision to close it. A platform that asks every owner for a weekly update and lists the key results still at zero on an OKR dashboard makes that visible while there's still a quarter left to act on it.
Data: OKRs Tool platform data, August 2026 export: 3,527 organizations, 29,987 key results and about 24,000 progress updates. The abandonment gap compares top- and bottom-quartile organizations by hit rate among organizations with four or more objectives. A key result "hit" when it reached 70% or more of target. Behavioural data from teams using OKRs Tool.