These performance management statistics come from original research, not a recycled roundup: an independent survey of 230 People and HR leaders at technology companies. The headline finding sets the tone — 66% trust their performance ratings are accurate, but only 27% say a manager could defend one with goal evidence. What follows is the full set, grouped by what each number reveals about how ratings actually get made.
Nearly every performance management statistic you'll find online is the same handful of third-party numbers passed between blog posts. The figures below are different: they come from the Performance Rating Benchmark Report, an independent survey of 230 People and HR leaders, alongside two other original OKRs Tool studies — The State of Goal Management and the OKR Intelligence Report. Every stat is sourced and grouped so you can cite the one you need, whether you're evaluating performance management software or building the case for connecting reviews to your OKR program.
Trust vs. Proof: The Headline Numbers
The central finding in performance management is a gap between how much ratings are trusted and how few can be proven.
66% of HR leaders say their performance ratings are highly trusted. Only 27% say nearly all managers could defend every rating with documented goal evidence if a score were challenged. 65% have personally seen a rating the goal evidence didn't support — 39% more than once, 27% once.
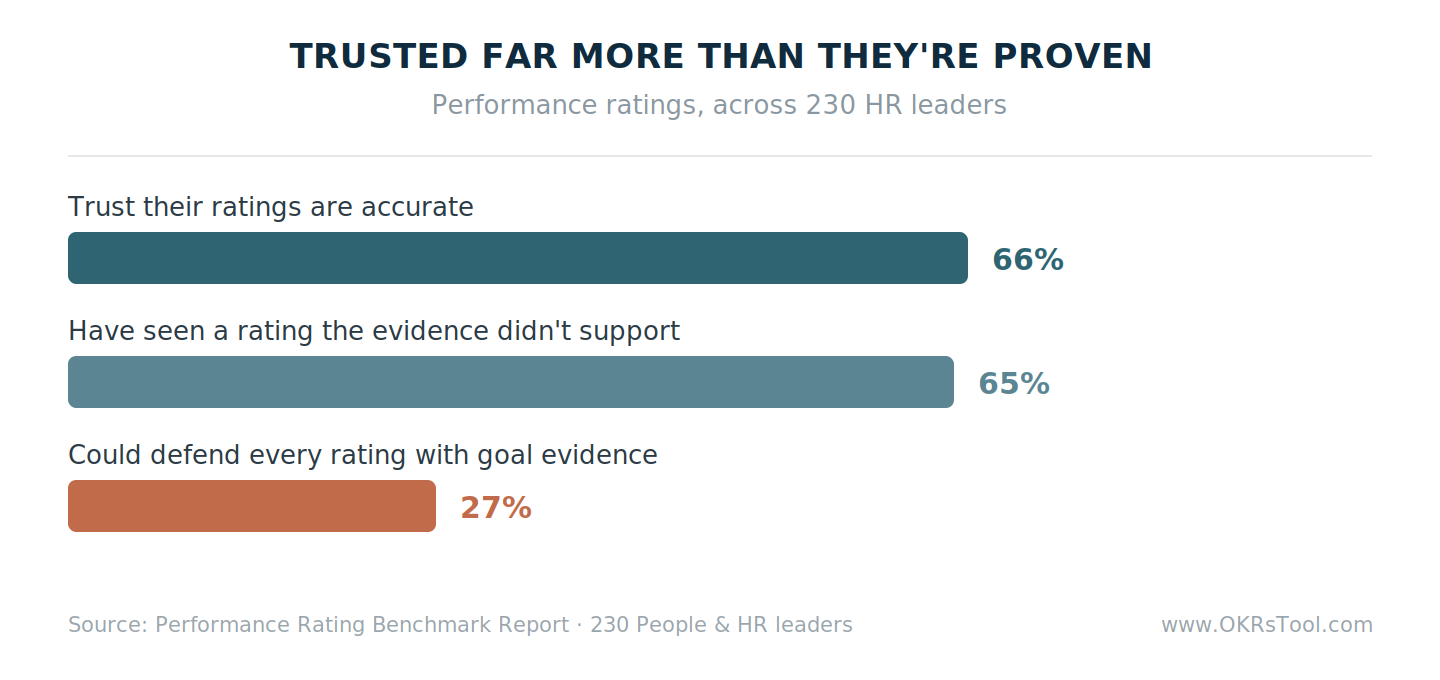
Among the leaders who say ratings are highly trusted, 36% still admit only a minority of managers could defend a score, and 62% have seen an unsupported one. The trust and the doubt sit inside the same person.
What Actually Drives a Rating
Leaders know what a score should rest on. What it rests on in practice is another matter.
60% say full-period goal delivery should most influence a rating, but only 55% say it actually does. 45% concede something other than goal delivery — recency, presence, or self-advocacy — is what actually moves the number. "Most recent work" climbs from a hoped-for 20% of influence to an admitted 28%, the single largest gap between what should and does drive a score.
Only 52% say a manager's recall covers the full review period evenly; for the rest, the review is written from the last month or two. The connection between Key Result delivery, its named owner, and the final score is looser than any leader intends.
Recency and Proximity Bias
Where a complete goal record is missing, bias fills the gap — and the data shows it's structural, not incidental.
68% of leaders have watched a strong performer rated lower because their best work happened early in the period and faded by review time. 62% say remote or hybrid staff are at least somewhat disadvantaged in ratings, and 26% say meaningfully so — out of sight lowers the score.
These patterns recede when a time-stamped goal record and structured 360 feedback replace memory as the basis for the rating, which reframes recency and proximity as performance review infrastructure problems rather than manager-training problems.
Goal-Gaming: The Tighter the Link, the More the Gaming
A counterintuitive set of numbers from The State of Goal Management: making goals count toward ratings is the strongest driver of goal-gaming.
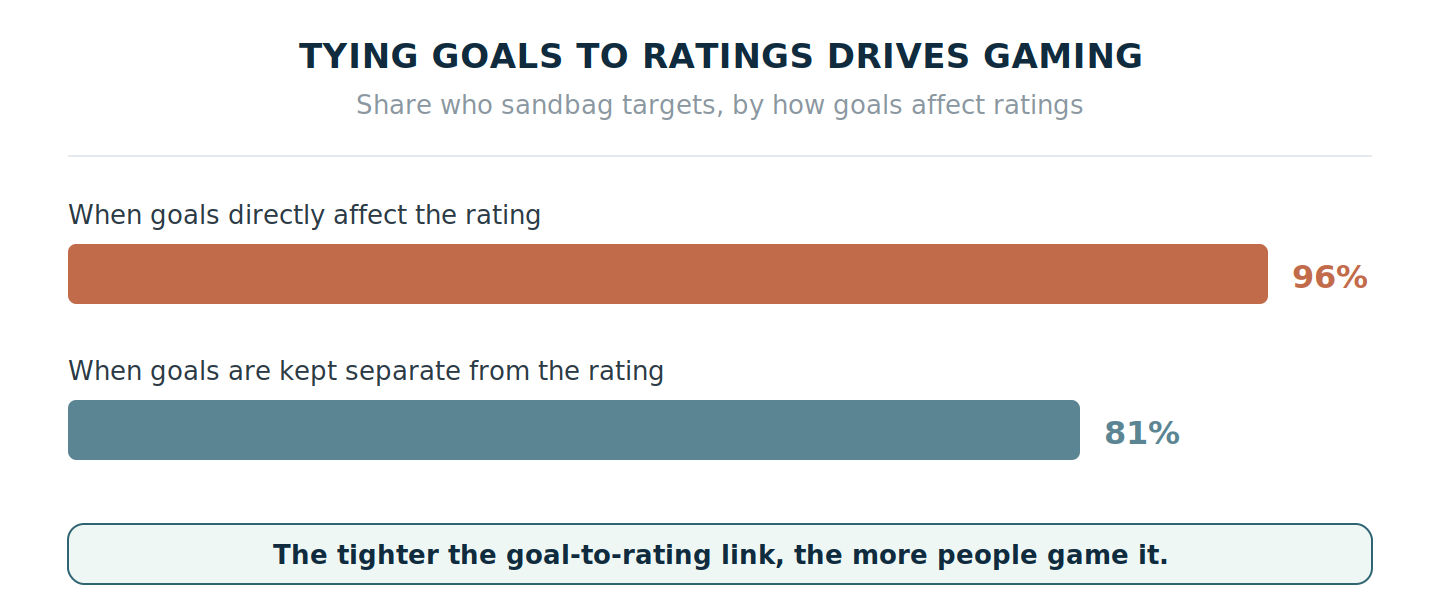
When goals directly affect ratings, 96% of employees sandbag their targets; when goals are kept separate, that falls to 81%. Across the study, 92% of employees admit to at least one gaming behavior, and 70% have watermelon-reported — a goal that looks green on the surface while the real status is red. 34% say nothing would change if their goal tracker were deleted tomorrow.
The mechanism meant to make goals matter is the one that teaches people to set targets they've already hit.
Two Calendars: Why the Goals Aren't in the Room
The structural cause behind the confidence gap is that goals and reviews run as separate processes.
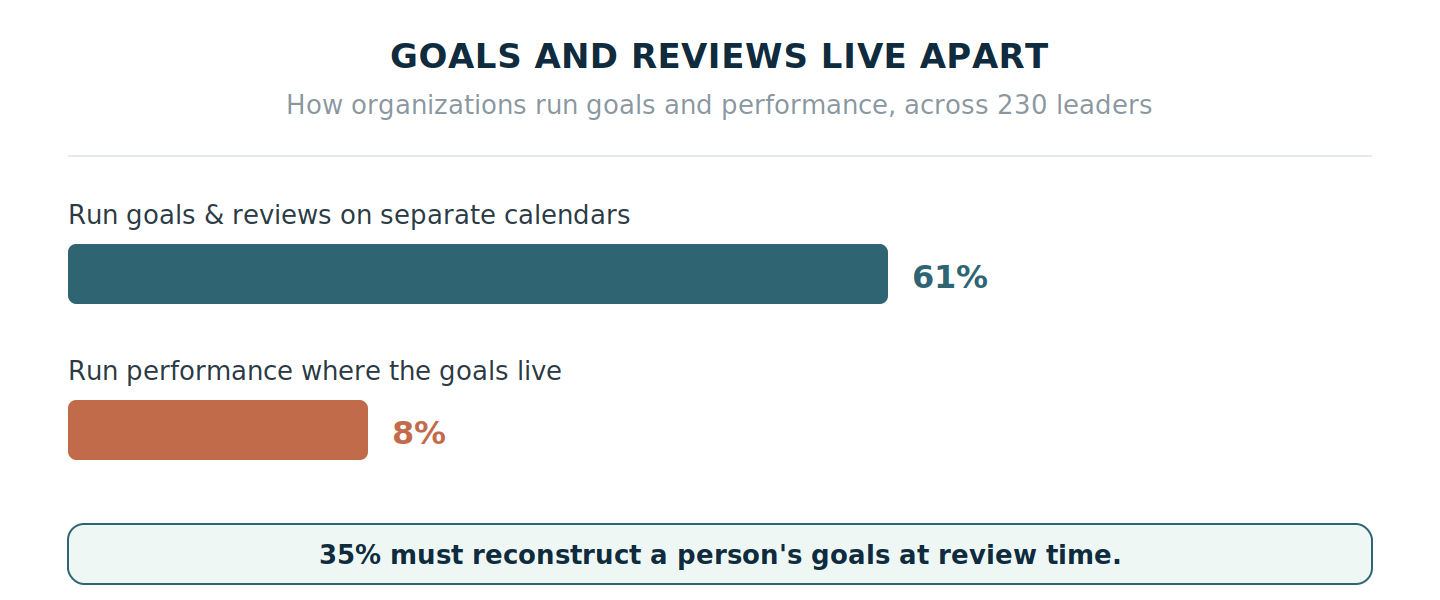
61% of organizations run goals and reviews on separate or disconnected calendars. 87% use goal achievement as a rating input, yet 35% say they have to reconstruct a person's goals at review time rather than read them from one place.
The payoff for closing that gap is measurable: teams that run goals and reviews as one integrated cycle are more than twice as likely to say a rating could be defended — 42% versus 17% — and far less likely to have seen an unsupported one, 53% versus 74%. Keeping the two on one cadence, in a single platform that holds both the goals and the review, is what makes a rating provable.
AI in Performance Reviews
AI has entered the review process faster than the record it needs to work from.
54% of leaders already use AI in reviews — 39% to summarize the period's work, 16% to draft reviews, 14% to surface bias or calibration. But among those using AI to summarize the period, only 10% run performance on a goal tool and 47% don't capture progress continuously at all — so nearly half are asking AI to summarize a period with no real record behind it. A continuous check-in record is the input that closes that gap.
Leaders name data privacy as their top AI concern at 37%; only 11% name the more fundamental problem, that AI has no goal record to draw from and invents specifics to fill the gap. On the goal side, the OKR Intelligence Report found teams using AI for both goal-writing and analysis accept a low score on a missed goal only 14% of the time, versus 35% for writing-only teams.
Where Performance Actually Runs
The infrastructure behind every other number: the tools that hold the rating and the tools that hold the record are usually different tools.
92% of organizations run performance on infrastructure with no live connection to their goals. Performance runs on dedicated performance software (37%), spreadsheets (29%), docs or HR forms (20%), nothing central (7%), and inside the goal or OKR tracking tool for just 8%.
49% review twice a year or less — the interval over which early-cycle work reliably disappears from memory. The record and the rating live apart because the tools that hold them are apart.
Methodology, in Brief
The primary source, the Performance Rating Benchmark Report, is an independent survey of 230 People and HR leaders — Heads of People, HRBPs, and People Ops leaders responsible for the review process — at technology companies of 50 to 200 employees. No OKRs Tool customers were included in the sample, and all findings are self-reported and describe association rather than causation.
The goal-gaming figures come from The State of Goal Management (210 employees) and the AI goal-writing figures from the OKR Intelligence Report (222 organizations).
For the full diagnosis behind these statistics — plus a self-assessment and a four-move action plan — read the complete Performance Rating Benchmark Report.
Data: The Performance Rating Benchmark Report (230 People and HR leaders), The State of Goal Management (210 employees), and the OKR Intelligence Report 2026 (222 organizations).