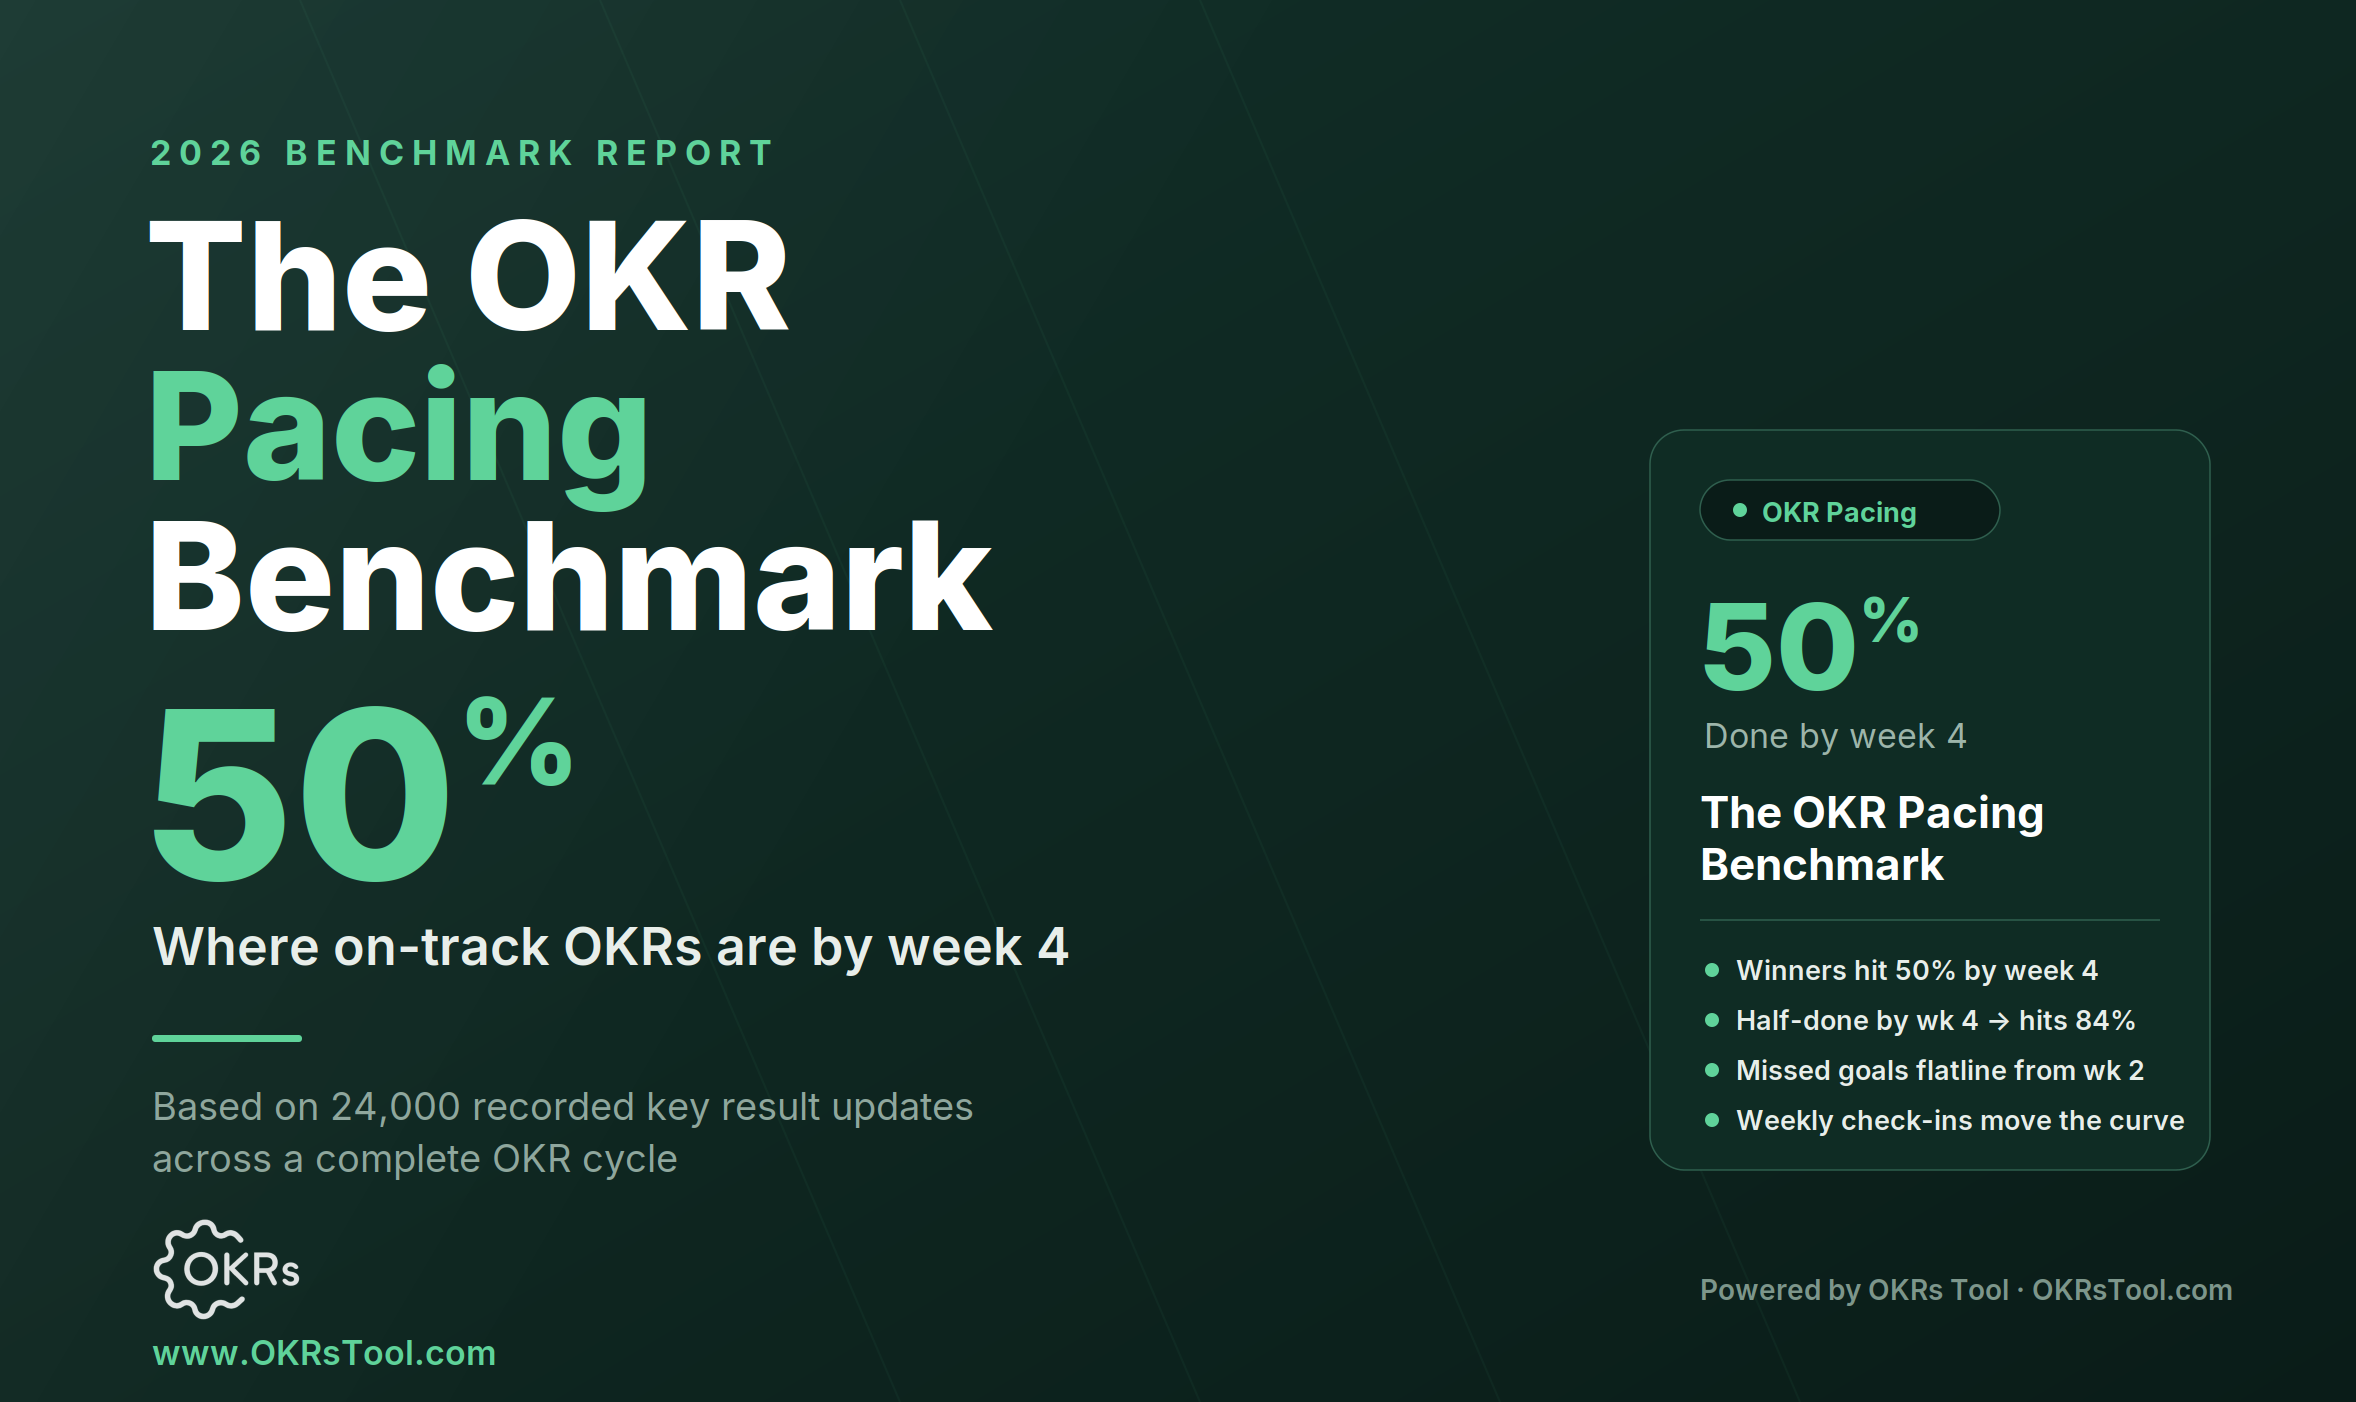
Key Results that hit their target are already halfway there by week 4 — a third of the way into the quarter. The ones that miss sit at 20% at the same mark, running at half the pace the whole way. The four-week checkpoint sorts the winners from the losers long before the quarter ends.
The standard mental model of an OKR cycle is a steady climb: start at zero, build through the quarter, arrive near the 70% "sweet spot" at the buzzer. Across 24,000 recorded Key Result updates, that's not what winning looks like. The goals that hit their target don't climb steadily to 70% — they front-load, banking half their progress in the first four weeks and crossing the finish line early.
That reshapes when a leader can act. If progress were linear, you'd have to wait most of the quarter to know a goal was in trouble. Because it's front-loaded, the gap between the goals that will hit and the goals that will miss is fully visible at week 4 — a third of the way in, with two-thirds of the quarter still left to intervene. This is a pacing benchmark: where your Key Results should be at each checkpoint, and what it means when they're not.
The Pacing Benchmark
Here is where Key Results sit at each checkpoint, split by whether they went on to hit their target. A "hitter" reached at least 70% of its target by cycle end; a "misser" fell short.
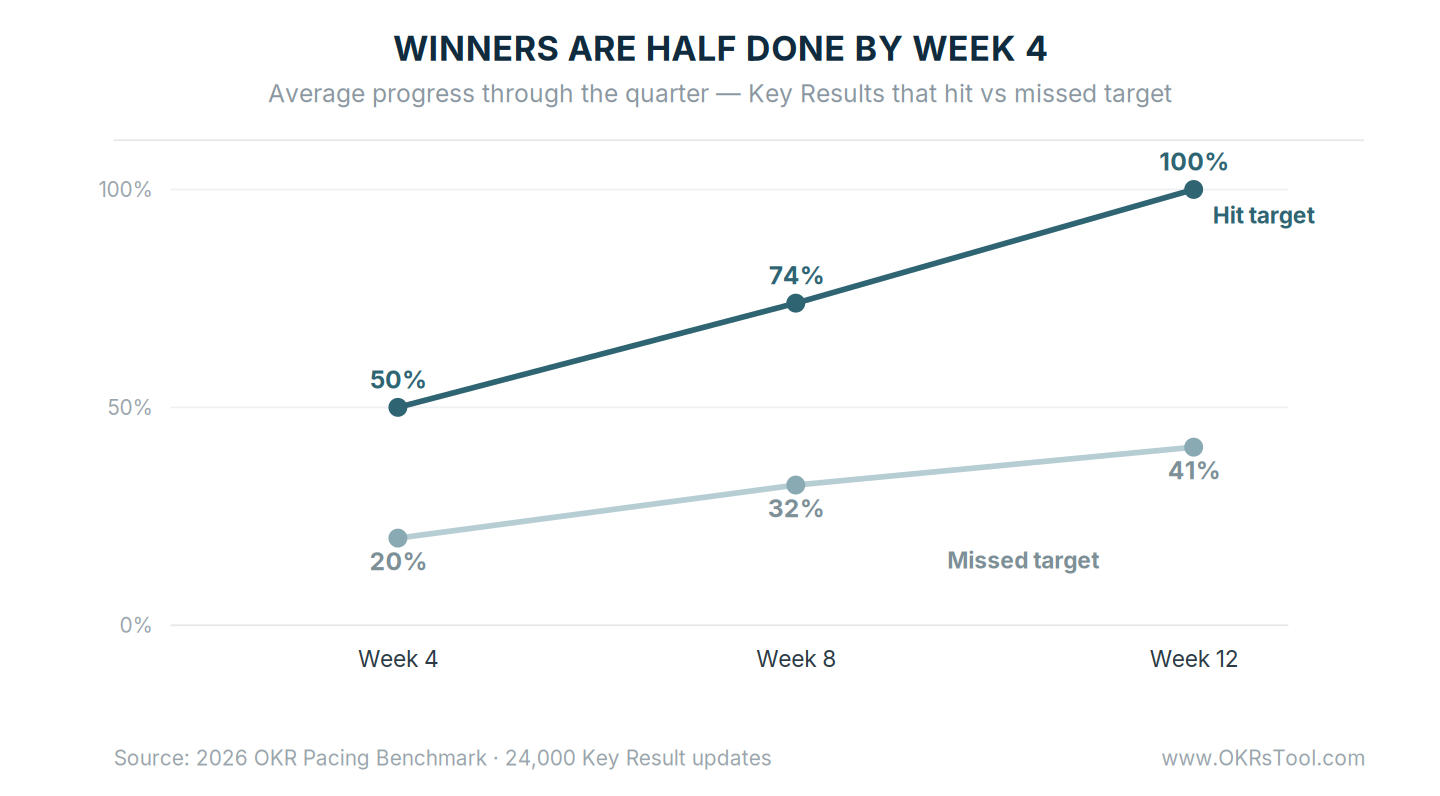
Two things stand out. The hitters cross their target line before the quarter closes — they finish at 100%, not the 70% the sweet-spot doctrine imagines, because a goal built to be hit gets there with room to spare. And the missers never run at more than roughly half the hitters' pace. They aren't a little behind and catching up; they're behind at week 4 and stay proportionally behind to the end.
The practical version is easy to hold in your head. By week 4, a Key Result should be near 50%. By week 8, near 75%. By week 12, done. A goal tracking well below that line at any checkpoint is on the missing team's pace, and the earlier you read that, the more quarter you have left to change it.
The benchmark holds whether the goal sits with one person or a whole team — what moves is the pace, not the level it's set at. Pull up your own live Key Results and mark where each one sits against these three checkpoints; the ones off the line are your intervention list.
Week 4 Is the Tell
Week 4 is the checkpoint that matters, because the sort happens fast.
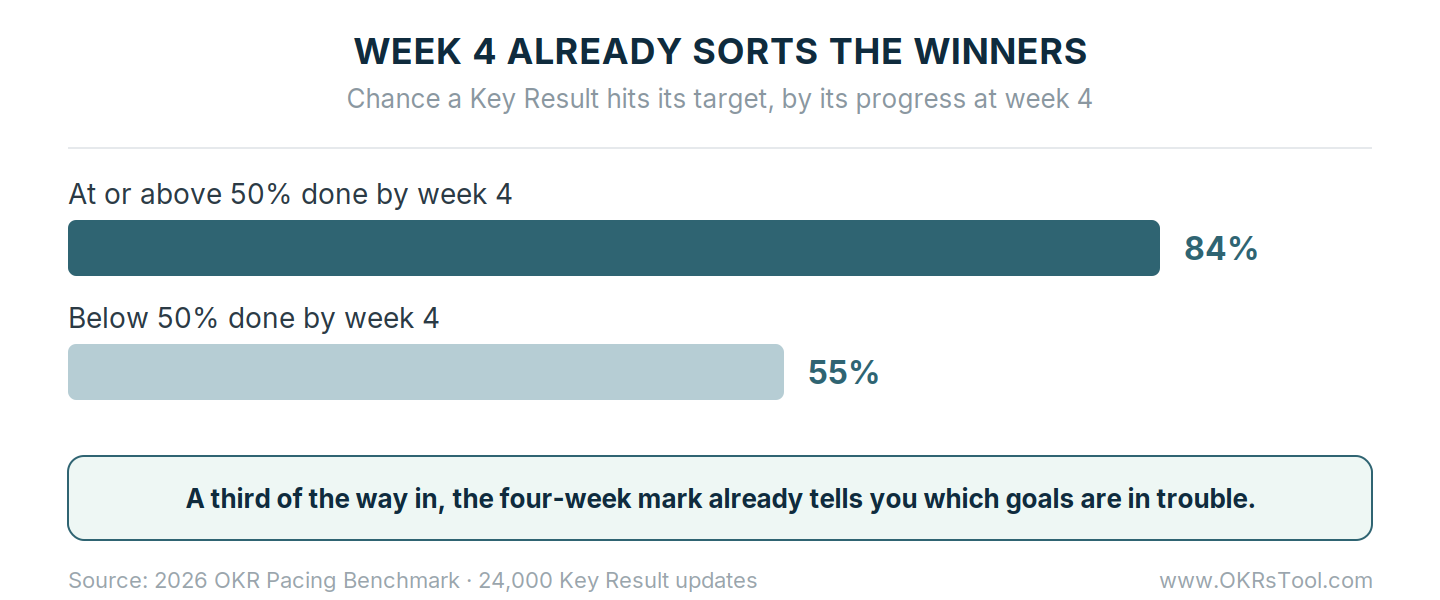
A Key Result at or above 50% progress by week 4 goes on to hit its target 84% of the time. One below 50% at the same mark hits only 55% of the time. A third of the way into the cycle, the four-week checkpoint has already split the goals that will land from the goals that are struggling — with eight weeks still on the clock to do something about it.
That's what makes this a warning line rather than a postmortem. Waiting for the end-of-cycle score tells you what happened. The week-4 read tells you what's about to happen, while there's still time to redirect people, cut scope, or reset the goal. A Key Result that isn't roughly half-done by week 4 needs attention now, not a note in the retrospective.
The First Check-In Carries the Same Signal Earlier
You don't even have to wait for a calendar week to see the pattern. The state of a Key Result at its very first check-in already predicts the outcome.
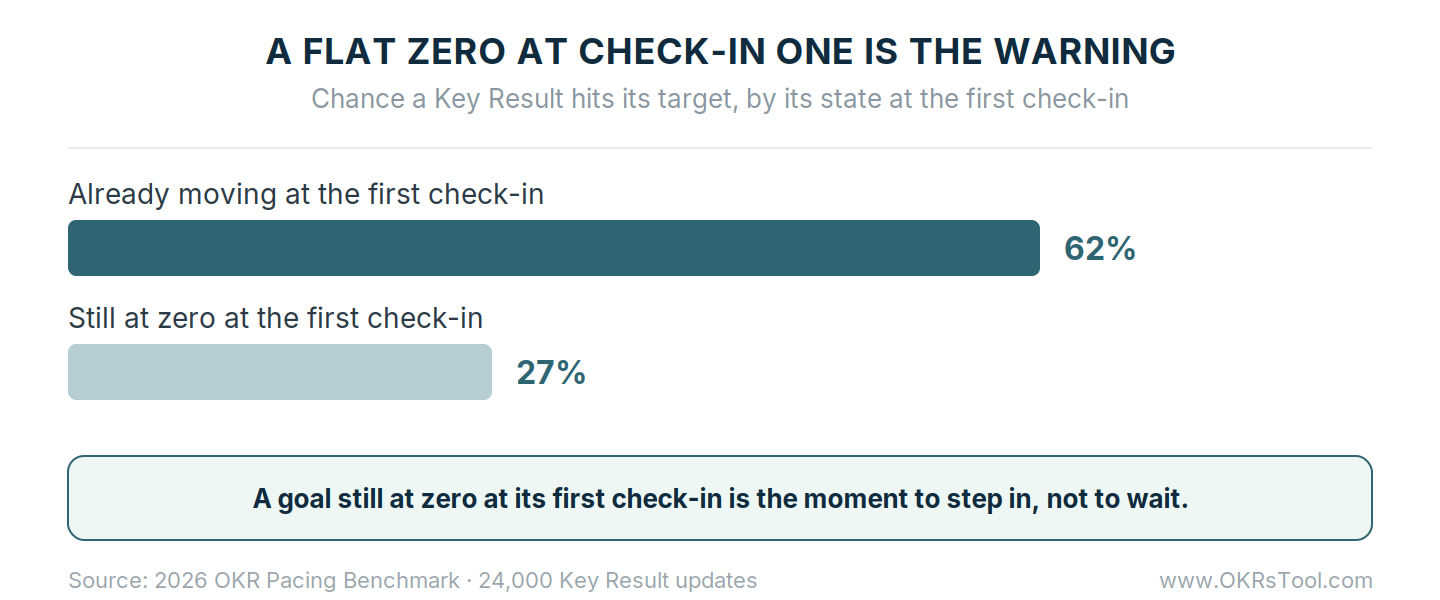
A Key Result already moving at its first check-in hits its target 62% of the time. One still sitting at zero at that first check-in hits just 27% — less than half as often.
A flat zero at the opening check-in is the single earliest reliable warning a goal will miss, and it reads the same way every time: a goal that hasn't started moving by the time anyone first looks at it is the one to step in on, not the one to give the benefit of the doubt. It's one of the clearest reasons OKRs fail that shows up before the cycle is even underway.
This is why the first check-in matters out of proportion to its place in the cycle. It's tempting to treat an early zero as normal — the work is just getting going. The data says the opposite: an early zero is the strongest predictor of a late miss, and the teams that treat it as a trigger rather than a shrug — often in a standing check-in meeting — are the ones whose goals land.
How to Use the Benchmark
The benchmark turns tracking OKRs from a scoreboard into an early-warning system. Three checkpoints, three questions.
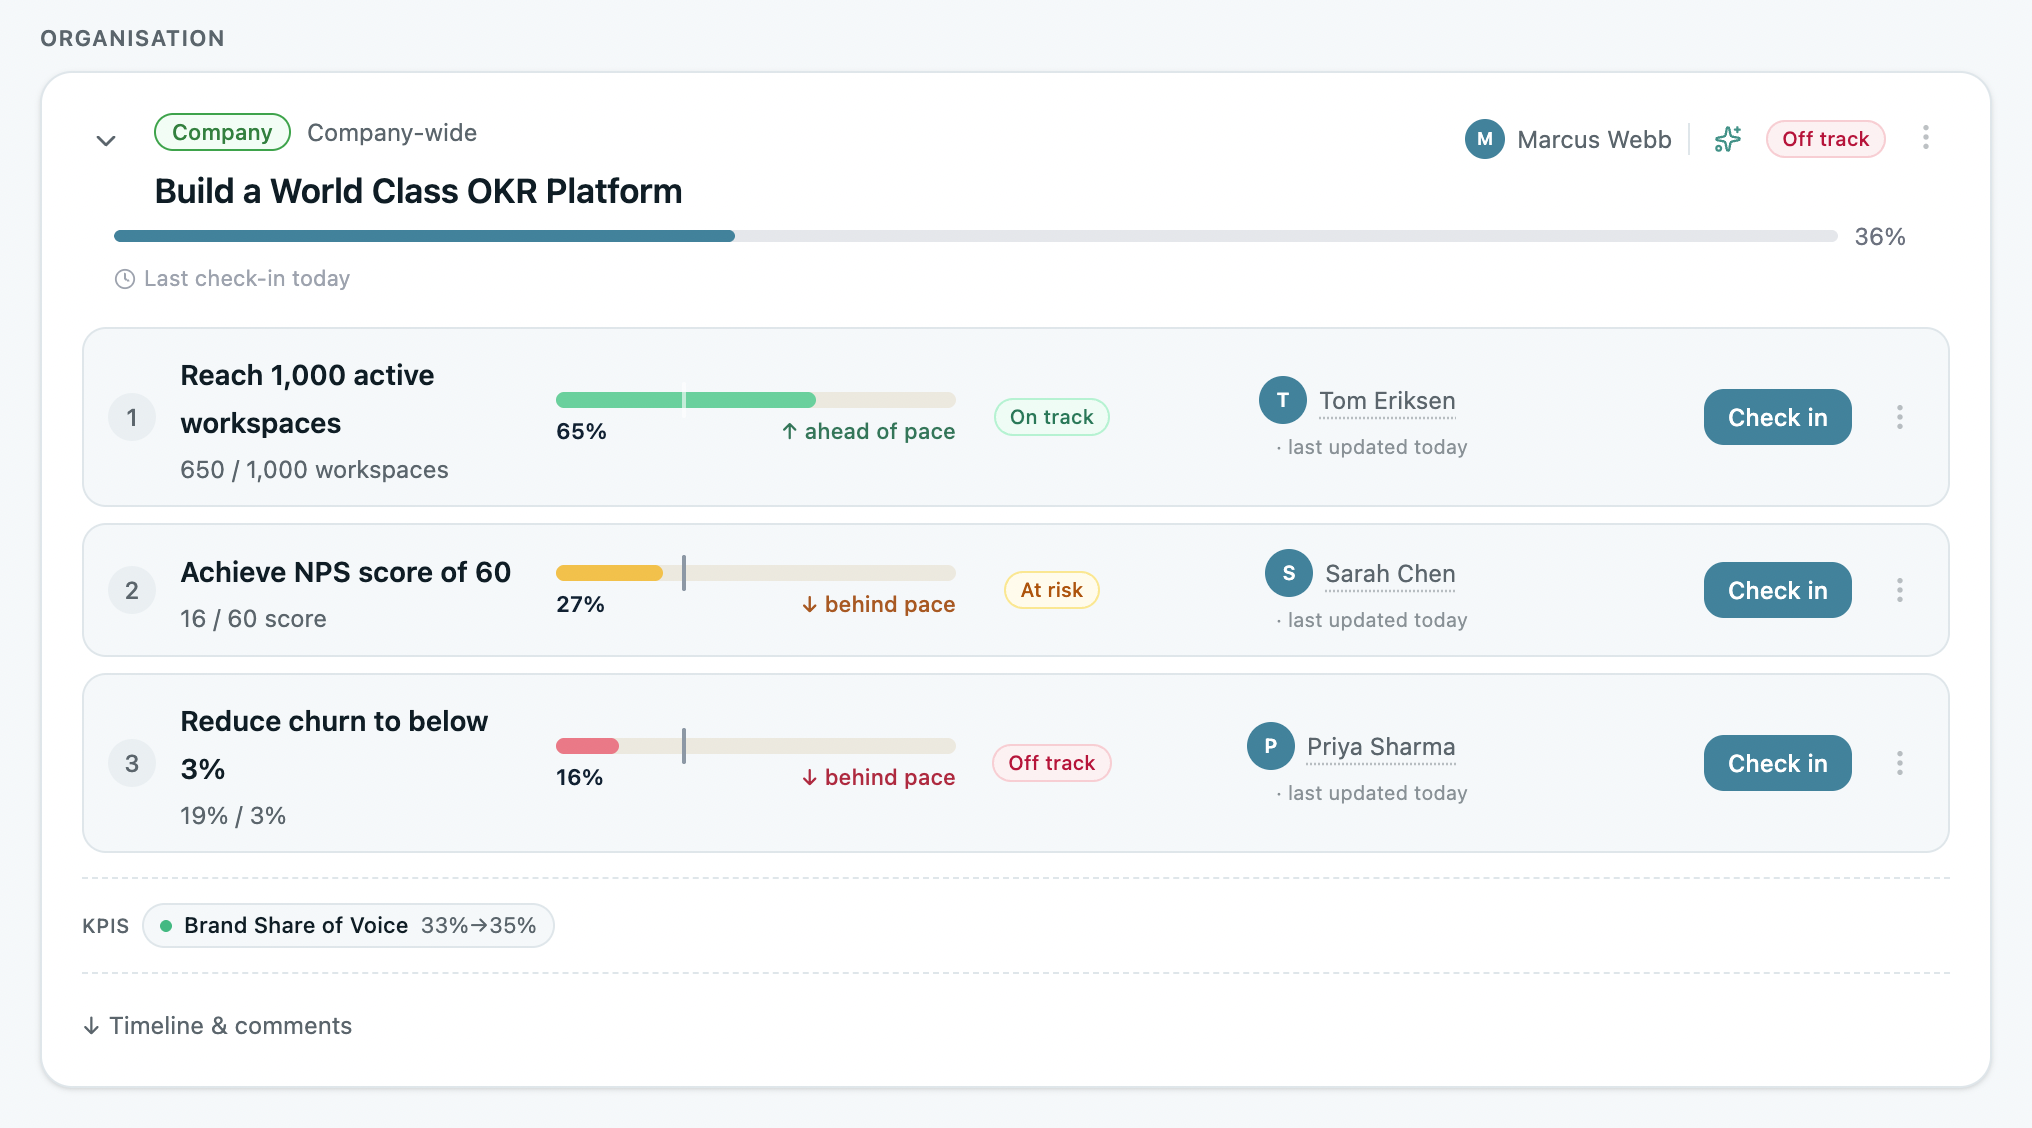
At the first check-in, ask whether each goal has moved off zero at all. The ones still flat are the ones to intervene on first — reassign the owner, unblock the dependency, or cut the goal before it absorbs a quarter. At week 4, ask whether each Key Result is near 50%.
Anything well below is on the missing team's pace and needs a course correction while two-thirds of the cycle remains. At week 8, ask whether each is near 75%, the last checkpoint where a lagging goal can still realistically be saved — which is exactly what a mid-quarter review is for. Reading the pace this way is what separates high OKR completion from a wall of red at cycle end.
None of this works without a weekly rhythm to surface the numbers, which is the check-in cadence the benchmark runs on — a Key Result touched once through the cycle hits its target 48% of the time, while one tended repeatedly across the quarter climbs past 70%.
The pacing line is only useful if someone reads it in time to act, and reading it in time means looking every week, not at the quarter's end. Watching every Key Result against its pace in one place is what turns the benchmark into a habit instead of the spreadsheet that stops getting updated.
Read the Pace, Not Just the Score
The score at the end of the quarter is the least useful number in an OKR cycle, because by the time you have it, nothing can be done. The pace is where the information lives. A Key Result near 50% by week 4, near 75% by week 8, done by week 12 is on the winning line; one running at half that pace is telling you — early, clearly, and with time still on the clock — that it needs help now.
The teams that hit their goals aren't working harder in the final weeks to close a gap. They're the ones who read the week-4 tell, saw which goals were behind pace, and acted while acting still mattered. The benchmark gives every team the same early read — if they look in time to use it.
So the answer to "what does good OKR progress look like" is now a specific line, not a feeling: 50% by week 4, 75% by week 8, done by week 12, with the first real movement logged inside the opening fortnight.
Any Key Result tracking near that line is on the winners' curve; any goal well below it is on the missers' — and the further into the quarter you notice, the less you can do about it. The value isn't in the numbers themselves but in having a curve to measure against at all, because a goal you can benchmark early is a goal you can still save.
Data: The 2026 OKR Pacing Benchmark, a behavioral analysis of 24,000 recorded Key Result updates across a complete OKR cycle on OKRs Tool.