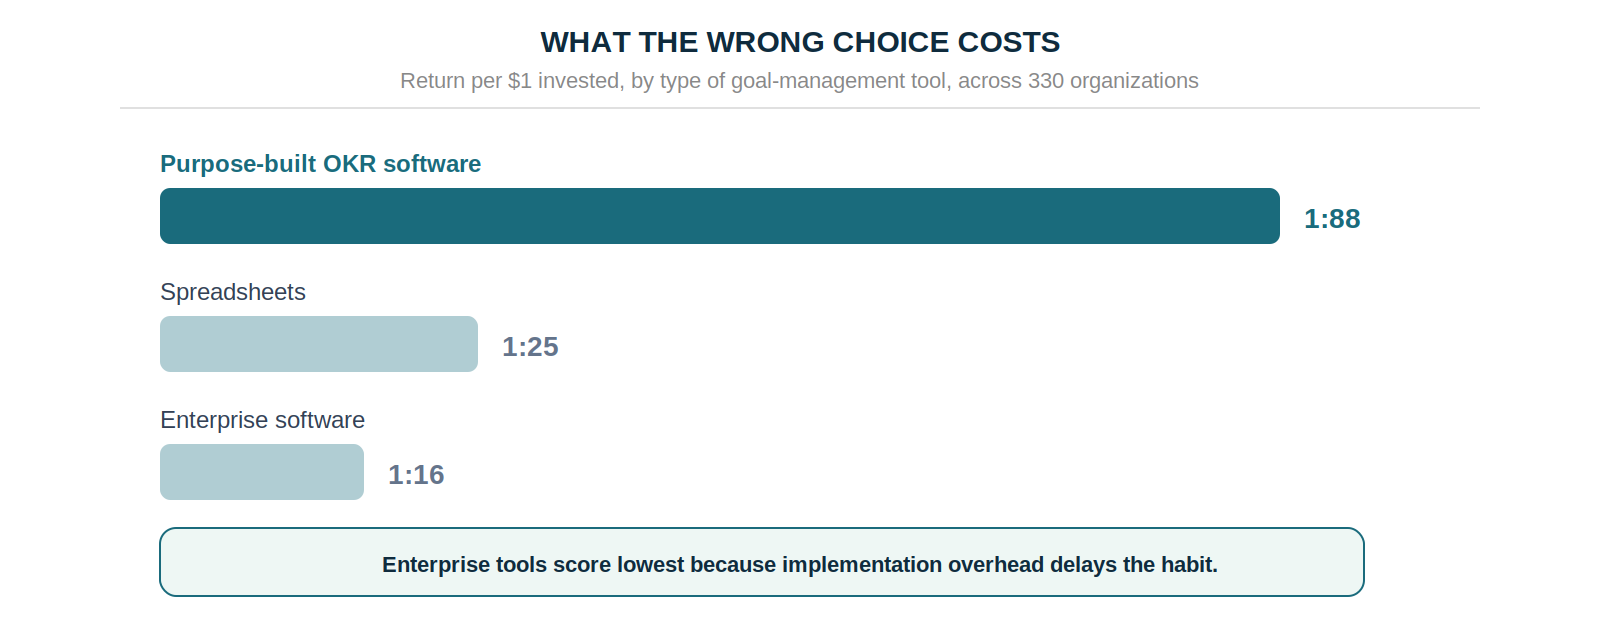
Purpose-built OKR software returns 1:88 per dollar against 1:25 on spreadsheets and 1:16 on enterprise suites — and the features producing that gap are narrower than any vendor's list suggests. Five tests predict whether a tool drives execution or becomes another tab nobody opens.
Choosing OKR software badly does more than waste a licence fee. It manufactures resistance: a tool too heavy for a 100-person company produces exactly the outcome of having no tool at all, with goals set in January, ignored by March, and quietly abandoned before anyone runs a retrospective. The cost is the quarter, not the subscription.
Knowing how to choose OKR software starts with knowing what actually correlates with results. The ROI of OKRs 2026 Benchmark Report, covering 330 organizations, found purpose-built goal software returns 1:88 per dollar against 1:25 for spreadsheets and 1:16 for enterprise suites. That spread traces to whether the tool makes the weekly execution habit structurally unavoidable, which is a much narrower question than any feature comparison implies.
The Five Tests That Predict Adoption
Each test below maps to a failure the benchmark data measures, which is what separates them from a feature checklist. Every vendor can claim goal hierarchy and progress tracking; almost none of that predicts whether a team is still updating in week nine.
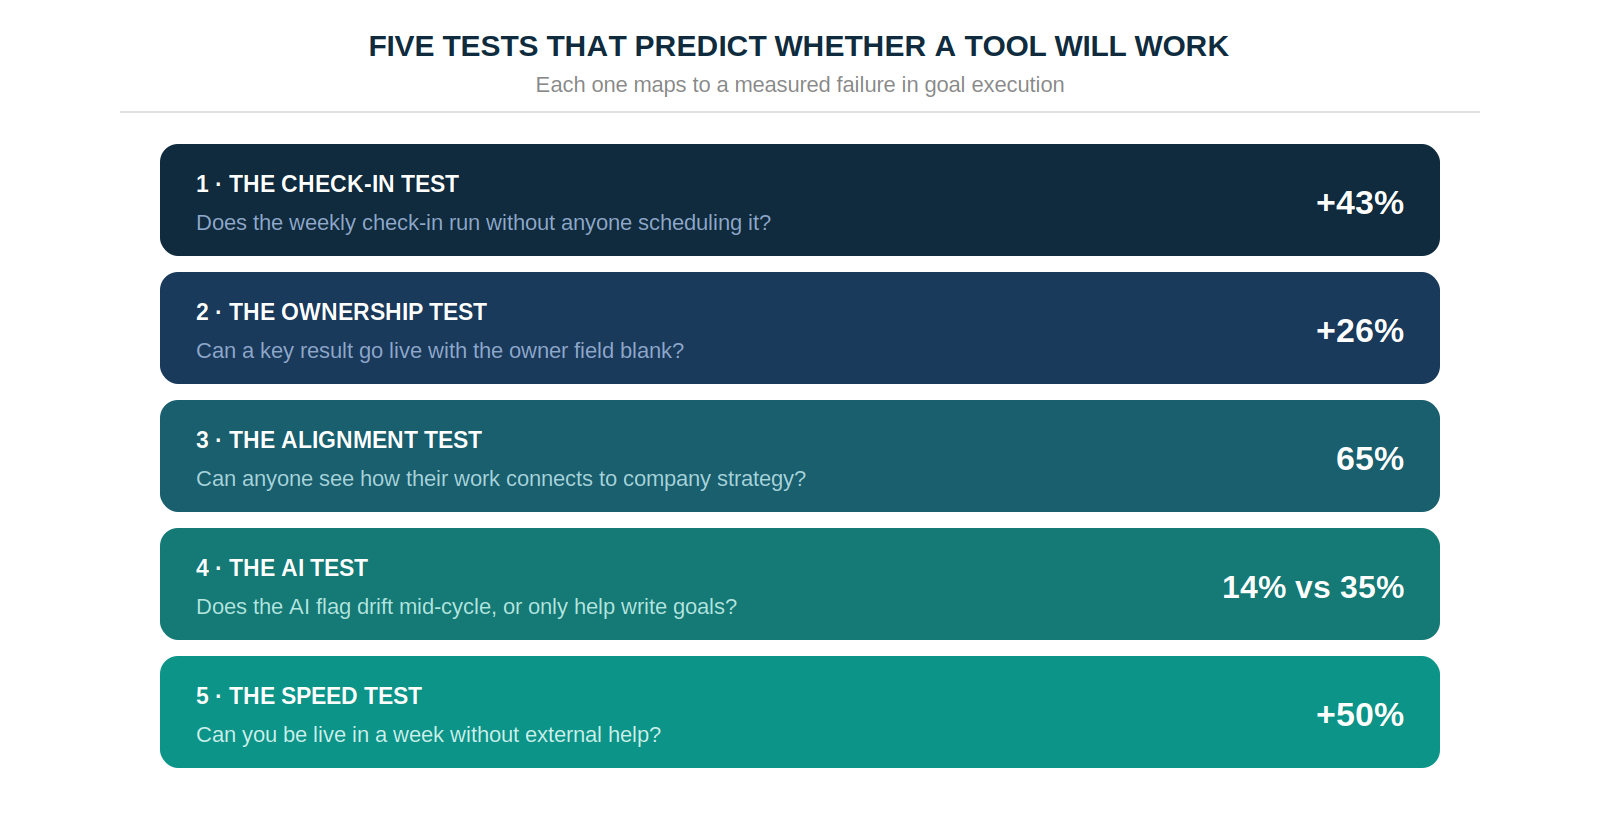
These five do, because each one corresponds to a specific point where goal programmes measurably break — the check-in that lapses, the owner nobody named, the strategy nobody can trace, the drift nobody catches, and the rollout that outlasts the quarter it was meant to start.
Test 1: Does the Check-In Run Without Anyone Scheduling It?
The highest-return capability in OKR software, and the one buyers most often underweight. Teams running a weekly check-in complete 43% more of their OKRs than teams reviewing monthly or ad hoc.
The distinction that matters is automated nudges versus manual scheduling. A tool that supports weekly check-ins but needs someone to book and chase them delivers what no tool delivers, because the check-in is the first thing dropped when a quarter gets busy.
The test: can the weekly check-in run with nobody scheduling it? Does the tool nudge each named owner automatically, on the same day, every week?
What a good answer looks like: the nudge fires into Slack or Teams on a fixed schedule, addressed to the person who owns the key result, with the update form inline so nobody has to open the tool to respond. What a weak answer looks like: a recurring calendar invite the tool helps you create, or an email digest sent to a channel where no individual is accountable for replying.
Vendors without this usually answer the question sideways. Listen for "you can set up reminders" — meaning someone configures them — or "we integrate with Slack," which may mean nothing more than posting updates after the fact. Ask who receives the nudge and what happens when they ignore it twice.
Test 2: Can a Key Result Go Live With No Owner?
Half of all key results across growing organizations have no named owner — the most common and most fixable failure in the whole framework. Teams enforcing single ownership complete 26% more of their goals than teams with shared or vague accountability.
What closes that gap is a structural gate rather than a prompt. A field that can be left blank will be left blank.
The test: does the tool refuse to publish a key result without a named owner, or does it merely ask?
Try it in the trial: create a key result and attempt to save it with the owner field empty. A tool built around ownership will block you. A tool that treats it as metadata will save happily, and six weeks later half your key results will belong to a team rather than a person.
Watch for the softer version of the same gap — tools that allow a team as the owner. It looks like accountability and functions as the opposite, because a goal owned by four people is a goal owned by nobody in particular. One name, or it isn't ownership.
Test 3: Can Anyone See How Their Work Connects to Strategy?
65% of teams admit their goals aren't clearly linked to company strategy. A live alignment map closes that gap by showing every team's key results connected to the company objective above them, updating without manual maintenance.
Speed of cascade matters here too. The OKR Intelligence Report 2026 found only 16% of organizations finish the full cascade within a single week — and a tool that maintains the connection structurally beats one where alignment is a document someone updates.
The test: can a team member open the tool and see how their key result ladders up to a company objective, in one view, without navigating three screens?
The difference shows up in who can answer the question. In a tool with real alignment visibility, an individual contributor can trace their own key result upward in a few seconds. In a tool without it, only the person who built the cascade can explain it — usually from a slide deck made during planning and never updated since.
A useful demo question: show me this from the perspective of someone who joined last week. If the answer requires an admin view or a walkthrough, the alignment lives in the configuration rather than in the daily experience.
Test 4: Does Your OKR Software AI Flag Drift, or Just Write Goals?
83% of organizations now use AI somewhere in their OKR process, but the writing layer and the analysis layer produce different behaviour.
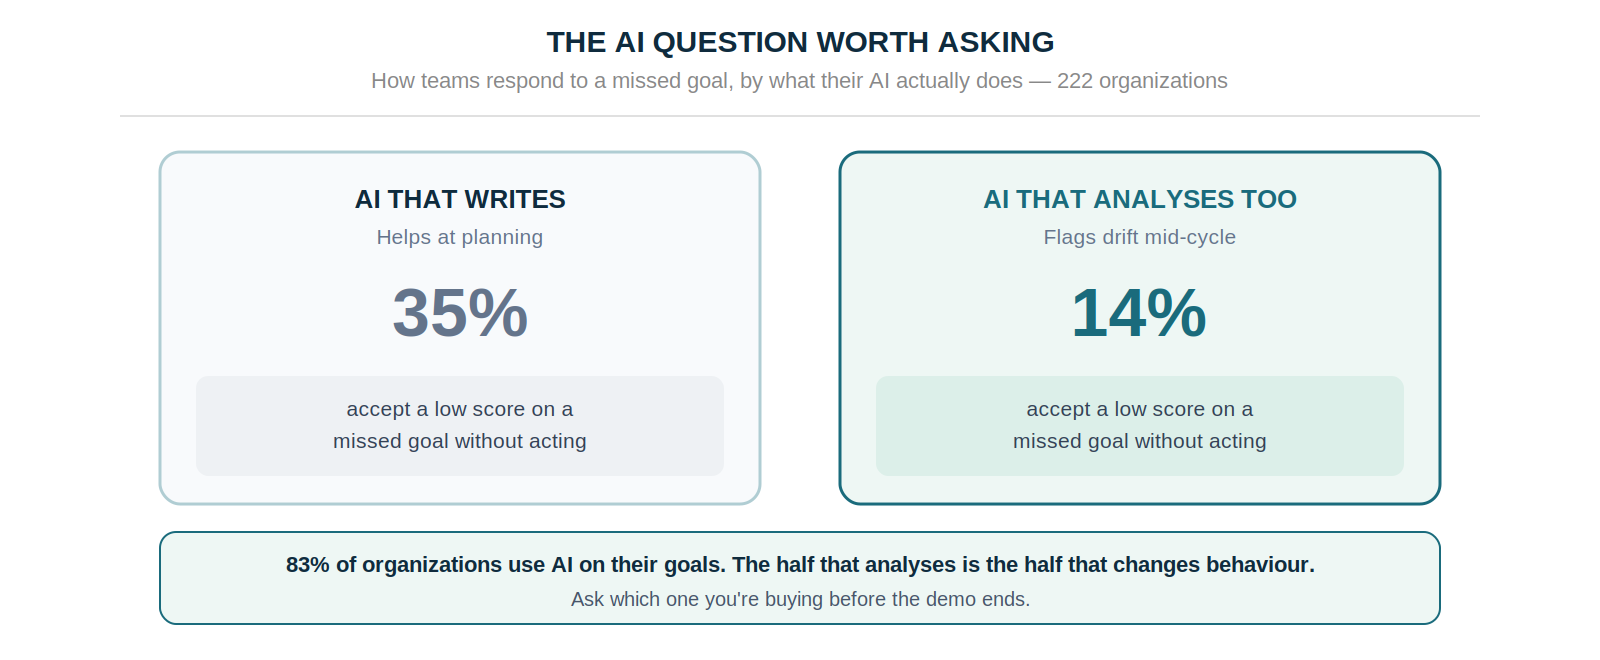
Teams using AI for both writing and analysis accept a low score on a missed goal only 14% of the time, against 35% for writing-only teams. Drafting assistance changes what goals look like at the start. Mid-cycle analysis changes what a team does when one starts slipping, which is where quarters are actually won.
The test: does the AI surface at-risk key results mid-cycle with specific recovery suggestions, or does it stop at helping you phrase them?
A writing assistant produces a better-worded objective in the planning session and then goes quiet for twelve weeks. An analysis layer keeps working: it notices that a key result has moved 8% in six weeks against a target that needs 50%, flags it while there's still time, and says something specific about what changed. The first is a convenience. The second is the thing that moves the 35% down to 14%.
Ask to see the AI's output in week six of a cycle rather than week one. Nearly every demo shows goal drafting, because it demos well. Very few show what the tool says when a goal is quietly dying.
Test 5: Can You Be Live in a Week Without a Consultant?
Teams launching in under a week see up to 50% higher completion than teams with drawn-out rollouts, and implementation overhead is a large part of why enterprise platforms return 1:16 rather than 1:88.
The test: can a department head sign up, invite the team, set company and team OKRs, and run the first check-in inside one week, without external help?
The signal to watch is whether evaluation itself requires a sales conversation. A tool you can't try without a scheduled demo is telling you something about its setup cost: platforms that need a guided walkthrough to make sense need the same guidance to roll out, and that overhead lands squarely in your first cycle — the one that decides whether anyone keeps using it.
The counter-argument is that enterprise platforms earn their implementation cost through depth, and for a 500-person company with compliance requirements that's often true. Below roughly 200 people it usually isn't: the time spent configuring is time not spent building the habit that generates the return.
Match the Tool to the Problem, Not the Headcount
Two companies of the same size with different broken things need different tools. Start from the failure that's actually costing you this quarter.
Buying enterprise software for a 100-person company because it has the longest feature list, rather than scaling into it later, is the error that produces the 1:16 return. The capabilities generating 1:88 are unglamorous — required ownership, automated check-ins, visible alignment — and every credible tool in the mid-market category has them.
Questions Worth Asking Before You Sign
On pricing. Per-seat or flat? What does this cost at 150 people? Per-seat pricing that looks cheap at ten becomes a growth tax at a hundred, and it quietly discourages the company-wide visibility OKRs depend on. The answer to listen for is a number you can multiply yourself; vague tiering usually means the price is negotiated against your headcount rather than published.
On implementation. What does week one look like? Is onboarding mandatory, or can a team lead get a cycle live independently? The answer predicts whether you're live in a week or a quarter. If the reply describes a phased rollout with a customer success plan, you're buying a project, not a tool.
On support. When something breaks mid-cycle, is there a person to reach or only a ticket queue? For a team running its first cycle, that matters more than the feature list — a broken check-in in week three, left unresolved for four days, is usually the moment a programme quietly stops.
On data. Where does goal data live, can you export it, and does the AI layer train on it? Data privacy is the leading AI concern in the Intelligence Report, flagged by 25% of organizations, and strategic goals are sensitive.
On the trial. Can you run a real cycle before committing — not a sandbox with sample data, but your own objectives with your own team? A tool that requires a sales demo to evaluate is structurally incompatible with the speed test above, and a trial too short to contain three check-ins can't tell you the one thing you need to know.
The One-Cycle Trial
Three tools maximum. More than that produces comparison fatigue and pushes the decision past the start of the next cycle.
Set one real objective in each tool, with two key results and a real named owner — not a sandbox example. Invite three colleagues who will actually use it. Then run three real check-ins across three weeks, updating progress the way you would in a live cycle.
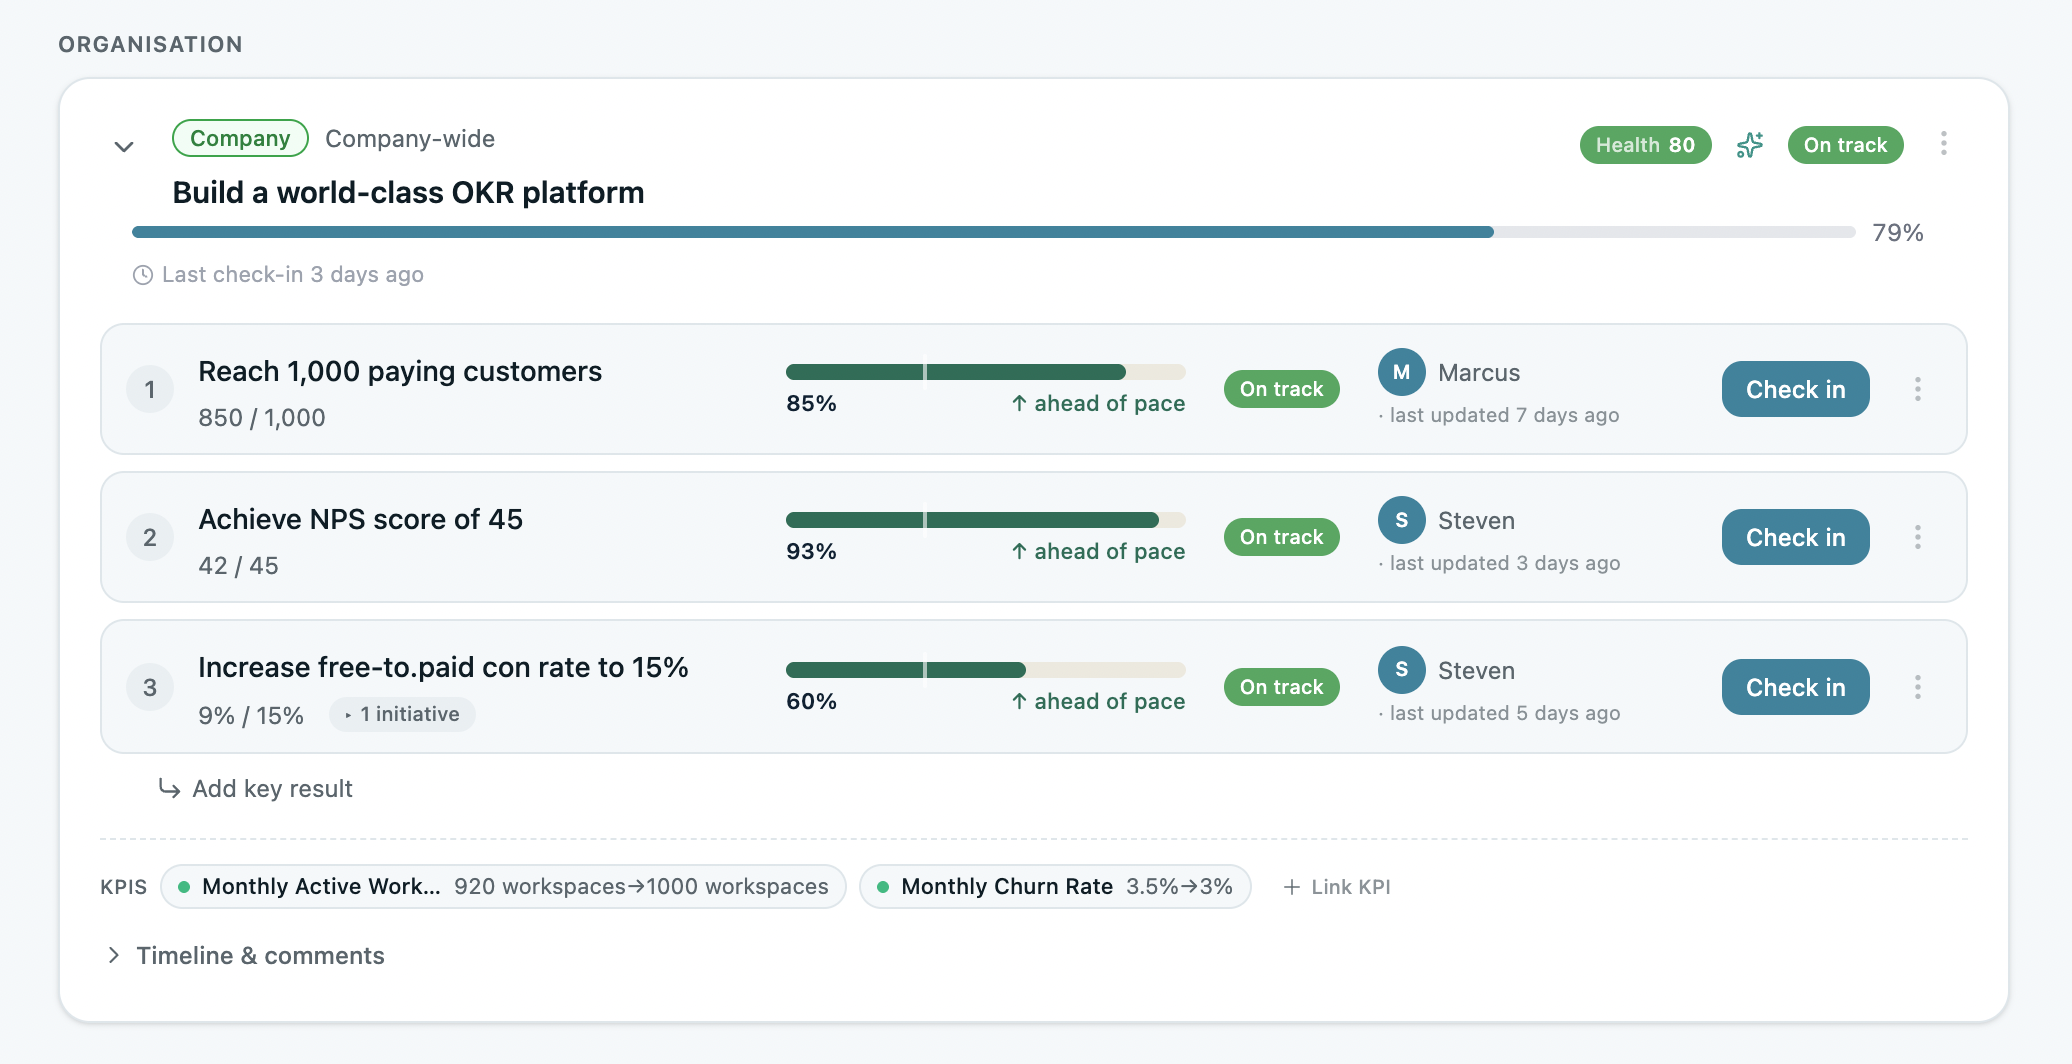
In week one, watch setup friction: how long from signing up to a live objective with an owner, and how many questions your colleagues ask before they can update something. In week two, watch what happens without prompting — whether updates land before the nudge, on the day of it, or only after you mention it in person. In week three, watch what the tool does with a goal that's behind: does it surface the problem, or does it wait for someone to notice?
At the end, one question decides it: did people update it without being chased? Every other signal in an evaluation is a proxy for that one. A tool that clears all five tests on paper and still needs chasing in week three will need chasing in week thirty — and no feature in the comparison table fixes that.
Score each tool on the five tests as you go, rather than reconstructing impressions afterwards. Memory flatters whichever tool you saw last, and the differences that matter — a nudge that arrived unprompted, an owner field that couldn't be skipped — are exactly the details that fade.
Pick the One They'll Open on Monday
The 1:88 return comes from a tool that makes the weekly habit structurally unavoidable — not optional, not dependent on anyone's discipline, not requiring someone to go and collect updates. That's a behaviour outcome, and it's what all five tests are really probing for.
So run them against three tools, set a real objective in each, and watch what happens over three weeks. Then choose on the only signal that predicts week six: which tool did people keep updating when nobody asked them to.
Data: The ROI of OKRs 2026 Benchmark Report (330 organizations), The 2026 OKR Benchmark Report (200 organizations), OKR Intelligence Report 2026 (222 organizations).