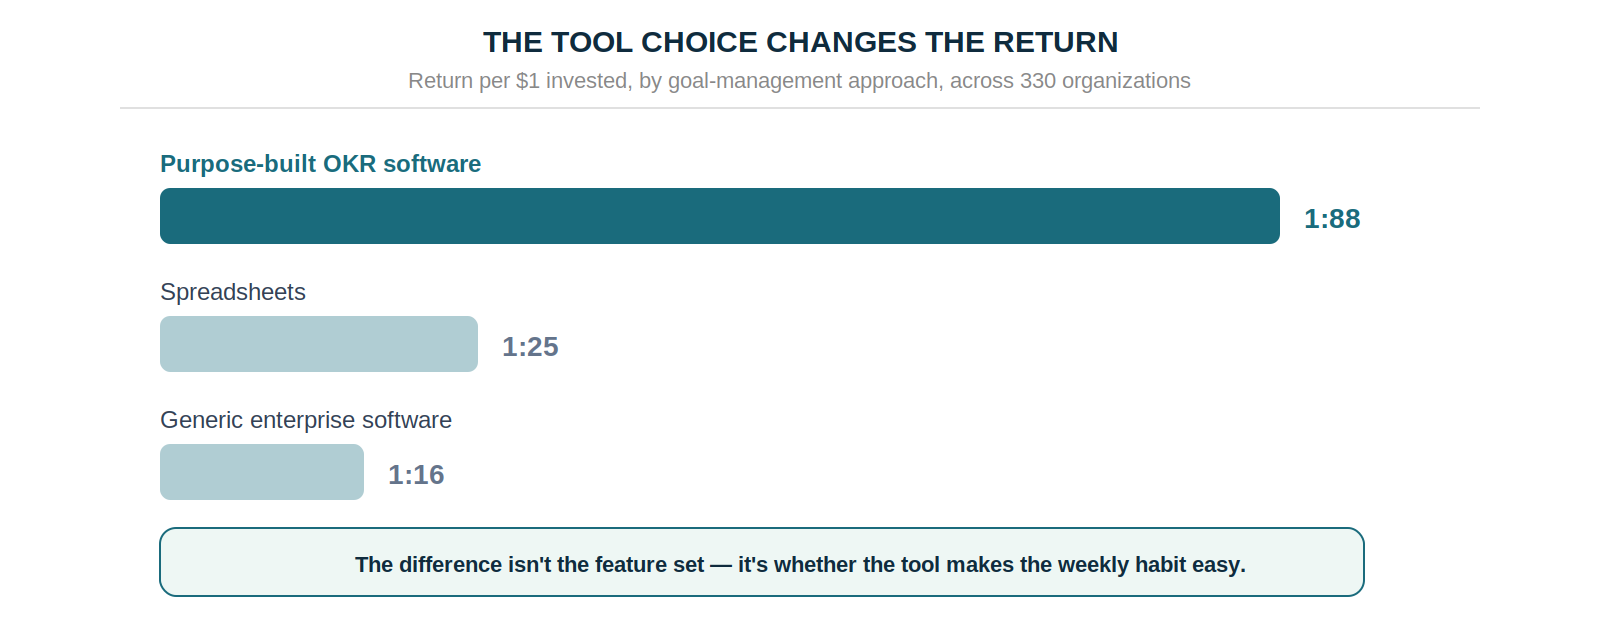
This OKR software comparison scores 35 tools on the features that actually move completion — weekly check-in infrastructure, ownership enforcement, AI, and pricing. The benchmark behind it is blunt: purpose-built OKR software returns 1:88 against 1:25 on spreadsheets and 1:16 on generic enterprise suites. The gap traces to whether the tool makes the weekly habit unavoidable, not to the feature list.
Choosing OKR software is one of the higher-leverage decisions a growing team makes for alignment and focus — and most comparison guides make it harder, not easier, by ranking tools on feature counts that don't predict whether anyone will actually use them.
This OKR software comparison takes the opposite approach: 35 tools scored on the handful of capabilities the benchmark data ties to real completion, with a matrix you can scan in two minutes and a recommendation matched to your team's stage.
The stakes are measurable. The ROI of OKRs 2026 Benchmark Report found purpose-built OKR software returns 1:88 per dollar, against 1:25 on spreadsheets and 1:16 on generic enterprise software. The difference comes down to whether the tool makes the weekly execution habit structurally easy to keep, rather than to the size of the feature set.
What Actually Matters in an OKR Software Comparison
Not every OKR tool is built for the same problem, and the features that demo well aren't always the ones that drive results. The benchmark data points consistently at a short list.
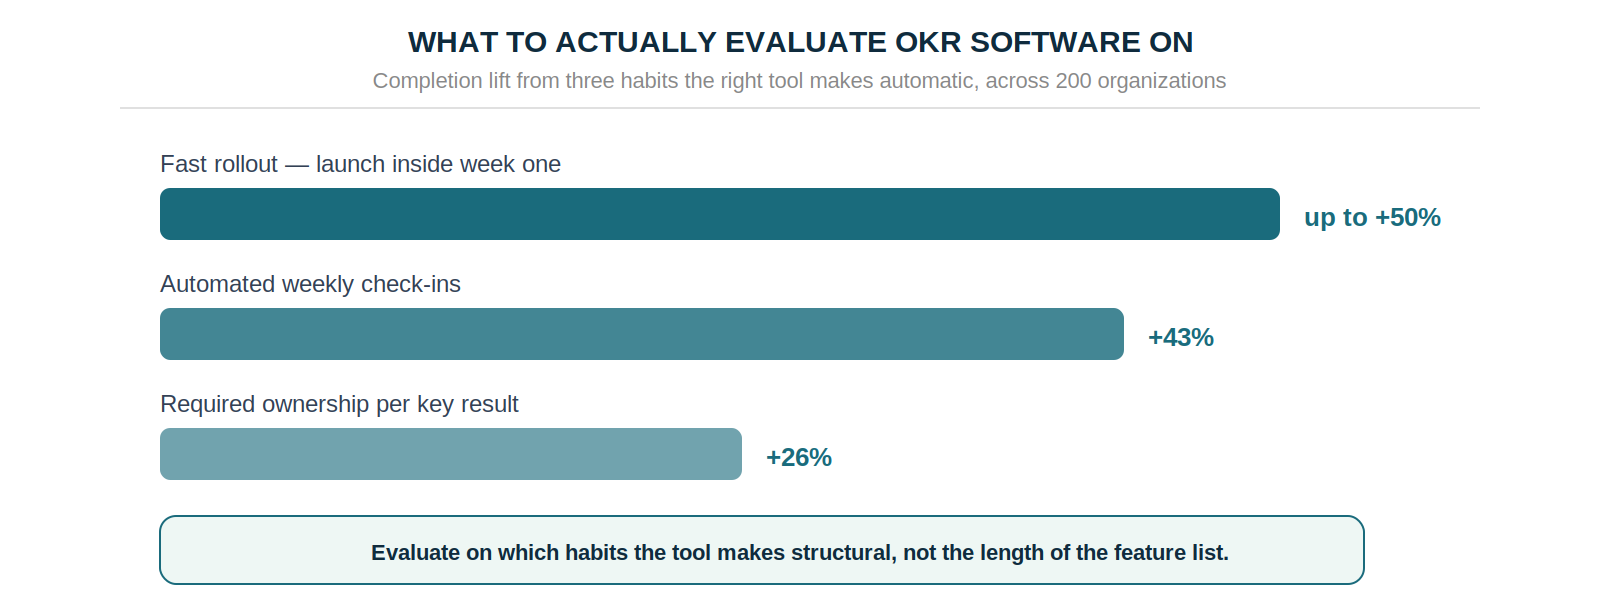
Weekly check-in infrastructure. A weekly check-in habit is worth 43% more completed OKRs against monthly or ad-hoc review. A tool that automates the rhythm — nudges, a lightweight update flow, no manual scheduling — is structurally different from one that merely supports check-ins as an option. The mechanics of running one are covered in the weekly check-in guide.
Required ownership per key result. Half of all key results across growing organizations have no named owner, and teams that enforce single ownership before a goal goes live complete 26% more of them. A tool that makes ownership mandatory closes that gap structurally rather than relying on discipline.
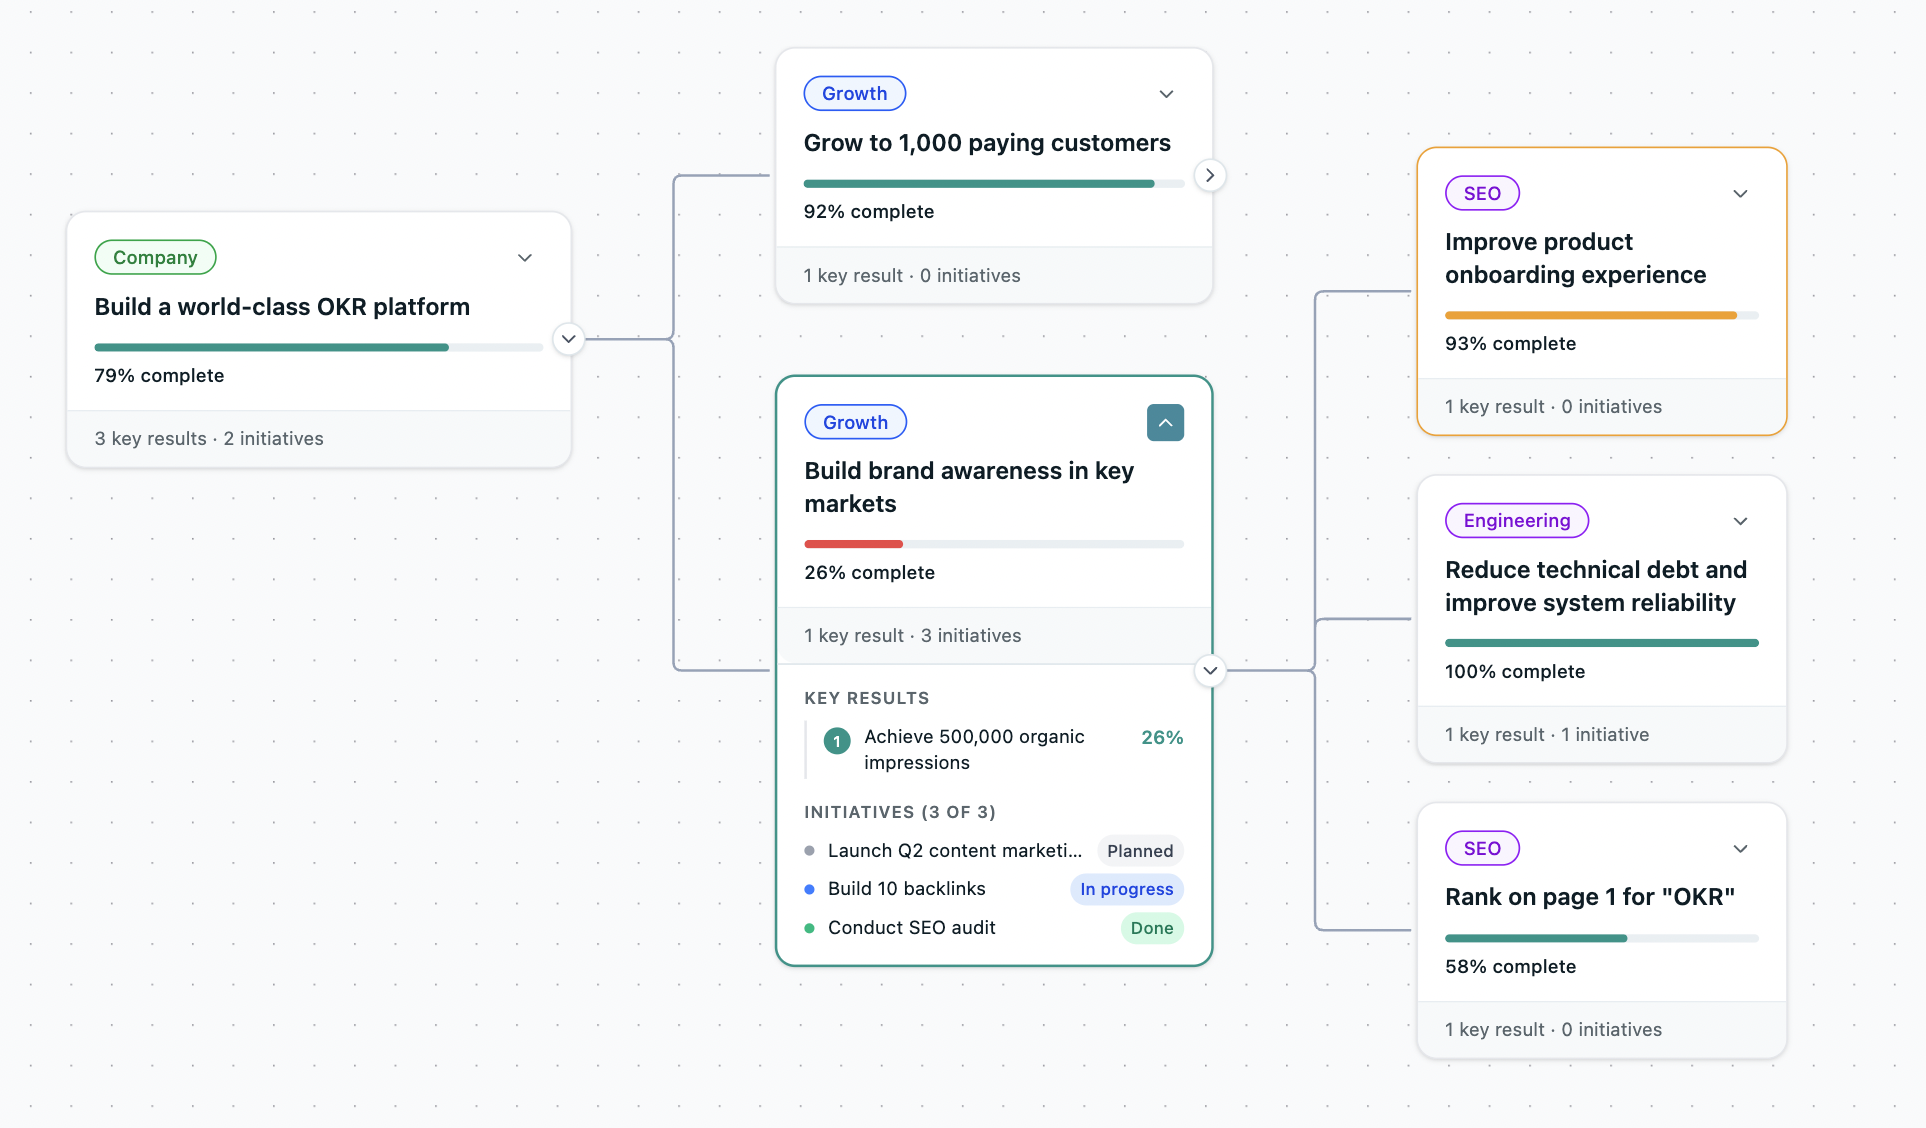
Alignment visibility. Roughly two-thirds of teams — 65% — say their goals aren't tied to company strategy. A live alignment map — showing how every team's work connects to company priorities — closes that gap the way cascading goals are meant to, without a standing meeting.
AI that analyses, not just writes. The split matters more than the presence of AI, which is why it gets its own section below.
Fast setup. Teams that launch in under a week see up to 50% higher completion than those with drawn-out rollouts. A tool that needs an implementation project carries that overhead straight into the first cycle's results.
Pricing that doesn't tax growth. Per-seat pricing that climbs with headcount is a structural misalignment with a tool the whole company needs to see. Flat-rate pricing stays predictable as you grow.
The OKR Software Comparison Matrix — 35 Tools
Every tool below was signed up for and tested hands-on, or assessed from vendor documentation and verified G2 reviews where an account wasn't available. Cells are marked from what each tool actually does; a blank rating means the tool has too few verified G2 reviews to cite a score.
Why the AI Column Deserves a Closer Look
Every second tool now advertises AI, so "AI features" as a yes/no tells you almost nothing. What matters in an OKR software comparison is which job the AI does.
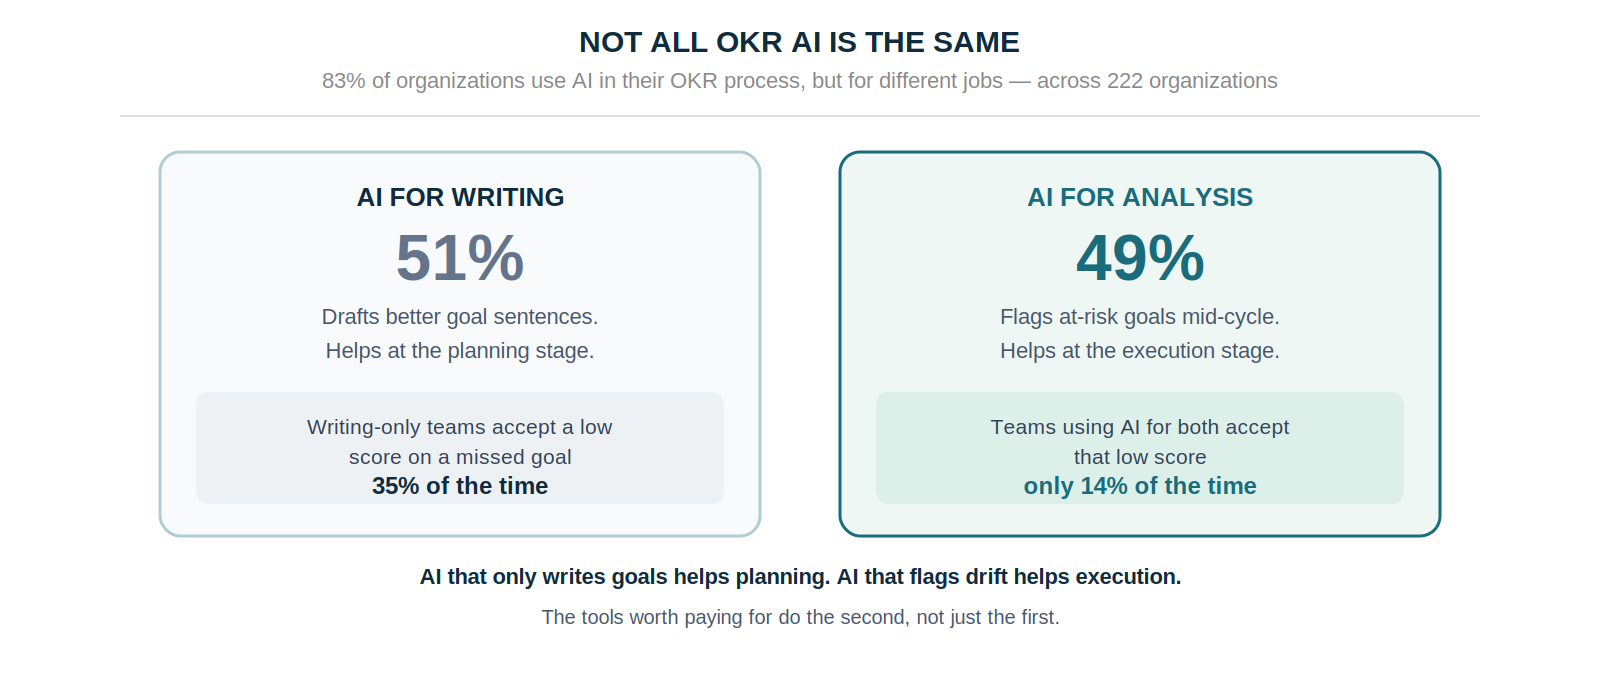
The OKR Intelligence Report 2026 found 83% of organizations now use AI in their OKR process, split roughly evenly between writing (51%) and analysis (49%). Those are different capabilities. AI that drafts a cleaner key result helps at the planning stage; AI that flags an at-risk goal mid-cycle helps at the execution stage — and execution is where goals are won or lost.
The report found teams using AI for both writing and analysis accept a low score on a missed goal only 14% of the time, against 35% for writing-only teams. When an OKR software comparison lists "AI," check which half you're getting.
What the Matrix Alone Won't Tell You
A feature grid is a starting point, not a decision. Four things decide whether the tool you pick actually works.
Adoption isn't automatic. The most common failure pattern is a tool chosen for its feature list, adopted in week one, and abandoned by week four. Something light and fast enough to build a weekly habit beats a richer tool nobody opens, and sidesteps the usual reasons OKRs fail.
Setup time predicts first-cycle results. The under-a-week launch advantage is real, and a tool that demands a dedicated rollout project spends that advantage before the cycle starts. Weigh time-to-live as heavily as any feature.
A tool won't fix a broken process. No feature set compensates for vague objectives or inconsistent check-ins. Pick the tool that reinforces the habits you want — weekly reviews, named ownership, honest scoring — rather than one that adds process for its own sake.
Per-user pricing compounds. A tool at $8 per user per month runs $800 a month at 100 people and $4,000 at 500. Flat-rate pricing stays flat; per-seat pricing becomes a growth tax, and it quietly discourages the whole-company visibility OKRs depend on.
Our Pick for Growing Teams
Full disclosure: OKRs Tool is our own product, so we're biased. We built it because we couldn't find a tool that made the weekly execution habit structurally unavoidable for a 50–200 person team without enterprise complexity or per-seat pricing.
The capabilities the data ties to completion — required ownership before any key result goes live, automated weekly nudges, a live alignment map, AI for both goal drafting and at-risk flagging, and OKR-linked performance reviews — are on by default rather than gated behind an enterprise tier. Pricing is flat: free for 1–5 users, $49/month for 6–50, $129/month for 51+ with SSO and concierge onboarding. No per-user fees.
If you're weighing alternatives from the matrix: Tability for the cleanest check-in UX, Perdoo for strategy-map plus KPI alignment, Teamflect for Microsoft 365 shops, and Betterworks alternatives for enterprise-grade performance management.
The Shortlist, in One Line
Thirty-five tools, one filter: which makes the weekly habit unavoidable rather than optional. For most growing teams that shortlist ends at OKRs Tool — but if the matrix pointed you to Tability's check-in UX, Perdoo's KPI mapping, or Teamflect for a Microsoft 365 shop, those are the right calls for those situations.
Start a free cycle, run one real week of check-ins, and you'll know inside seven days whether the tool disappears into the work or adds to it. That test settles the comparison faster than any feature grid.
Data: The ROI of OKRs 2026 Benchmark Report (330 organizations), The 2026 OKR Benchmark Report (200 organizations), and the OKR Intelligence Report 2026 (222 organizations).