Most OKR software feature lists are identical. Required check-ins, goal hierarchy, integrations, reporting. The features that actually separate tools that generate results from tools that generate activity are more specific than that — and the benchmark data makes the distinction precise.
_______________________________________________________________________________________________________
I've tested more than 20 OKR software platforms. The ones that generate the highest returns share a small set of structural features — not the longest feature lists.
The ROI of OKRs: 2026 Benchmark Report across 330 organizations found that organizations using purpose-built OKR software generate a 1:88 return on investment — compared to 1:25 on spreadsheets and 1:16 on enterprise software. The gap isn't the feature set. It's whether the tool makes the weekly execution habit structurally unavoidable.
That's the lens this guide uses. Not what sounds good in a demo — what the data shows actually changes execution behavior.
The Features That Generate the Highest Returns
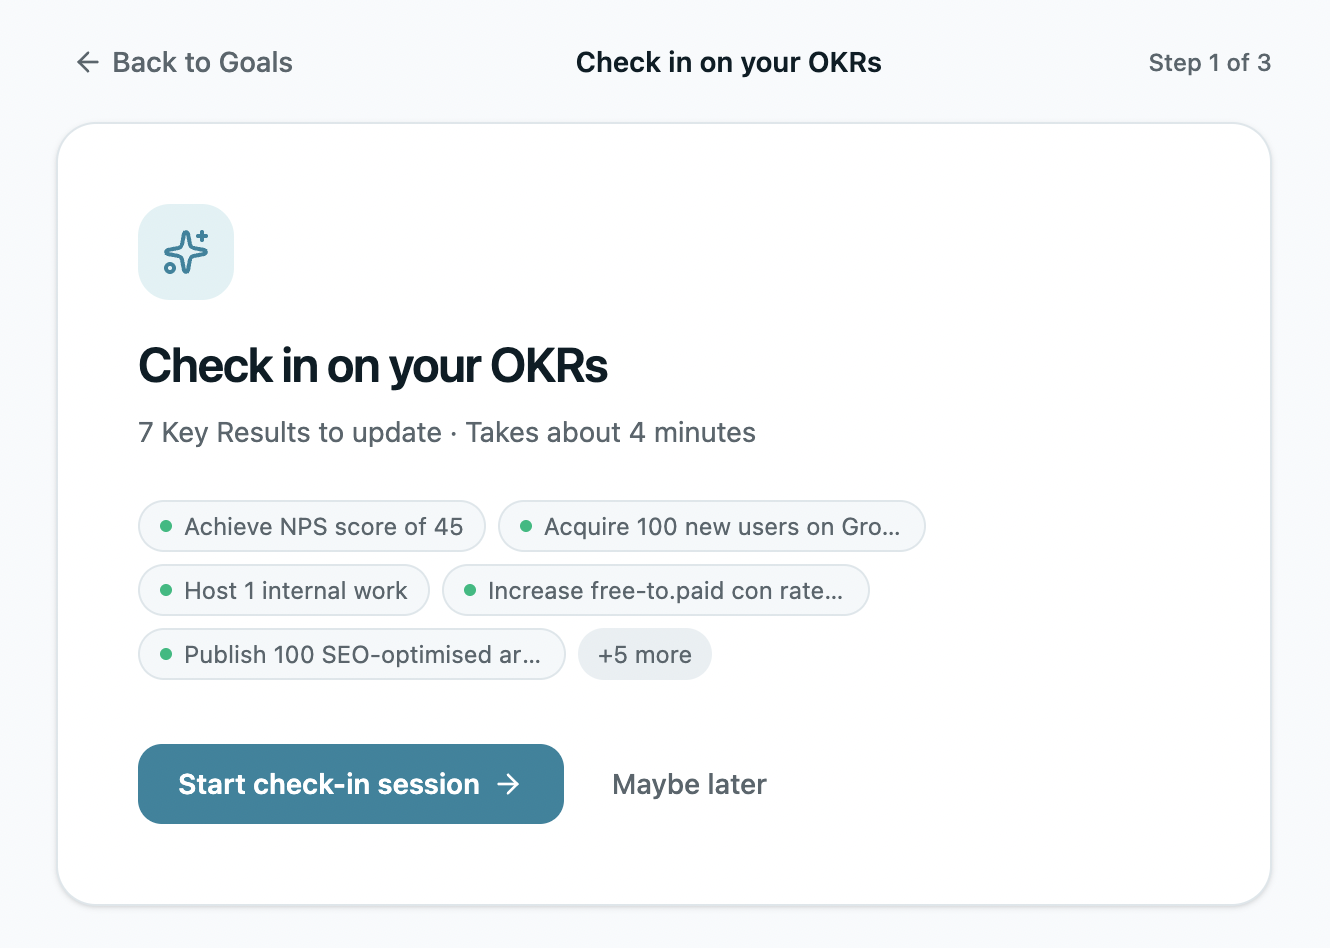
1. Automated Weekly Check-Ins
The single highest-return feature in OKR software — and the one most often treated as a nice-to-have.
Teams with a weekly check-in habit complete 43% more OKRs than those reviewing monthly or ad hoc. Teams that skip the weekly rhythm entirely are 3x more likely to abandon OKRs altogether.
The feature distinction that matters: automated nudges vs manual scheduling. A tool that supports weekly check-ins but requires someone to schedule and run them manually produces the same outcome as no tool — the check-in becomes the first thing dropped when the week gets busy.
What to look for: nudges that fire automatically at the same time every week, a lightweight update flow that takes under five minutes per person, and escalation visibility that shows leadership which Key Results haven't been updated.
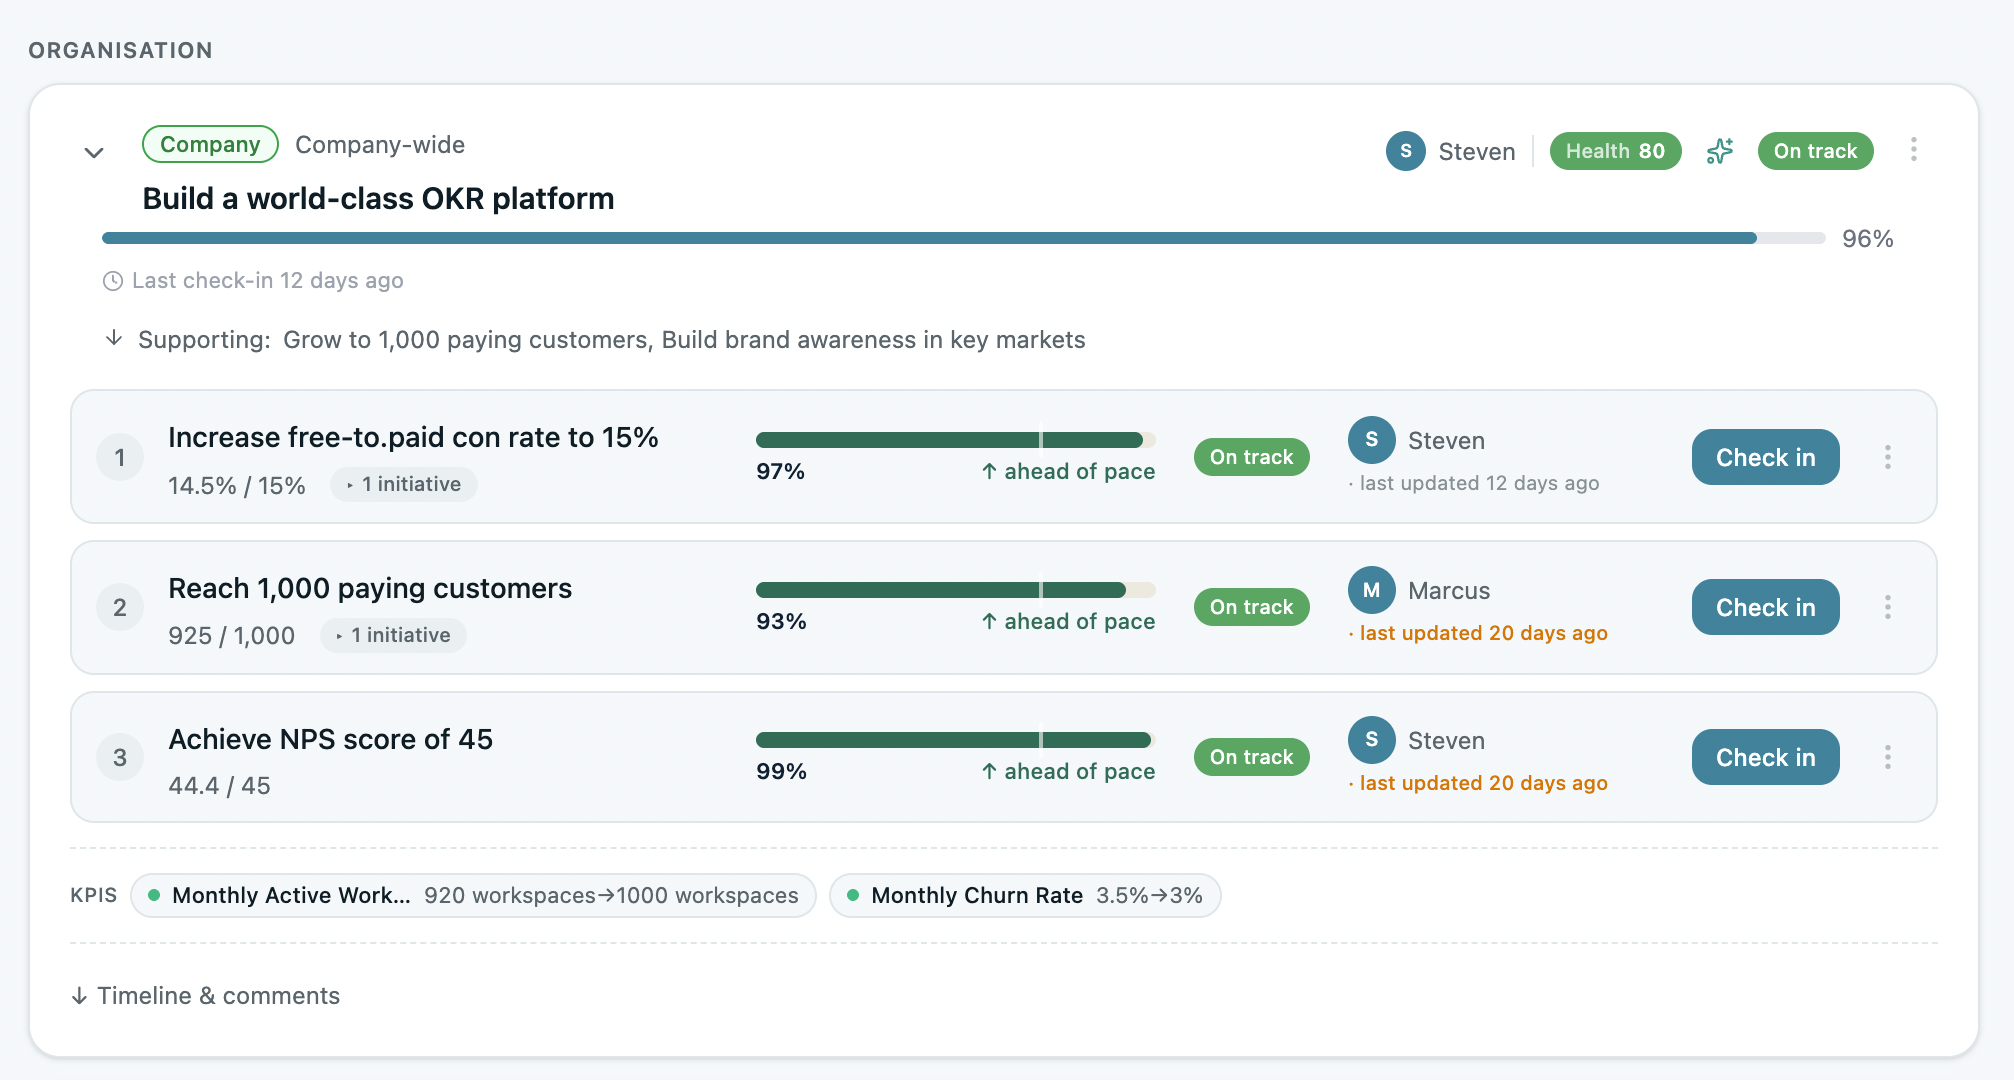
2. Required Single Ownership Per Key Result
50% of all Key Results across growing organizations have no named owner. This is the most common and most fixable OKR failure mode — and the feature that closes it structurally is a hard gate, not a prompt.
Teams with required single ownership per Key Result see 26% higher completion rates than those with shared or vague accountability. The feature distinction: a tool that asks you to assign an owner vs a tool that won't let the Key Result go live without one.
The first produces suggestions that get ignored. The second produces a structural change in how accountability works.
What to look for: ownership assignment as a required field — not optional — with the owner receiving automated check-in nudges and being named in leadership visibility views.
3. Live Alignment Map
65% of teams admit their goals aren't linked to company strategy. The alignment map is the feature that closes this gap structurally — showing every team's OKRs connected to company priorities in a single live view, updated automatically as goals are created and progress is tracked.
The OKR Intelligence Report 2026 found only 16% of organizations complete the full cascade within the same week. An alignment map that builds the cascade visually — and keeps it current — is the feature that makes that 16% accessible to everyone.
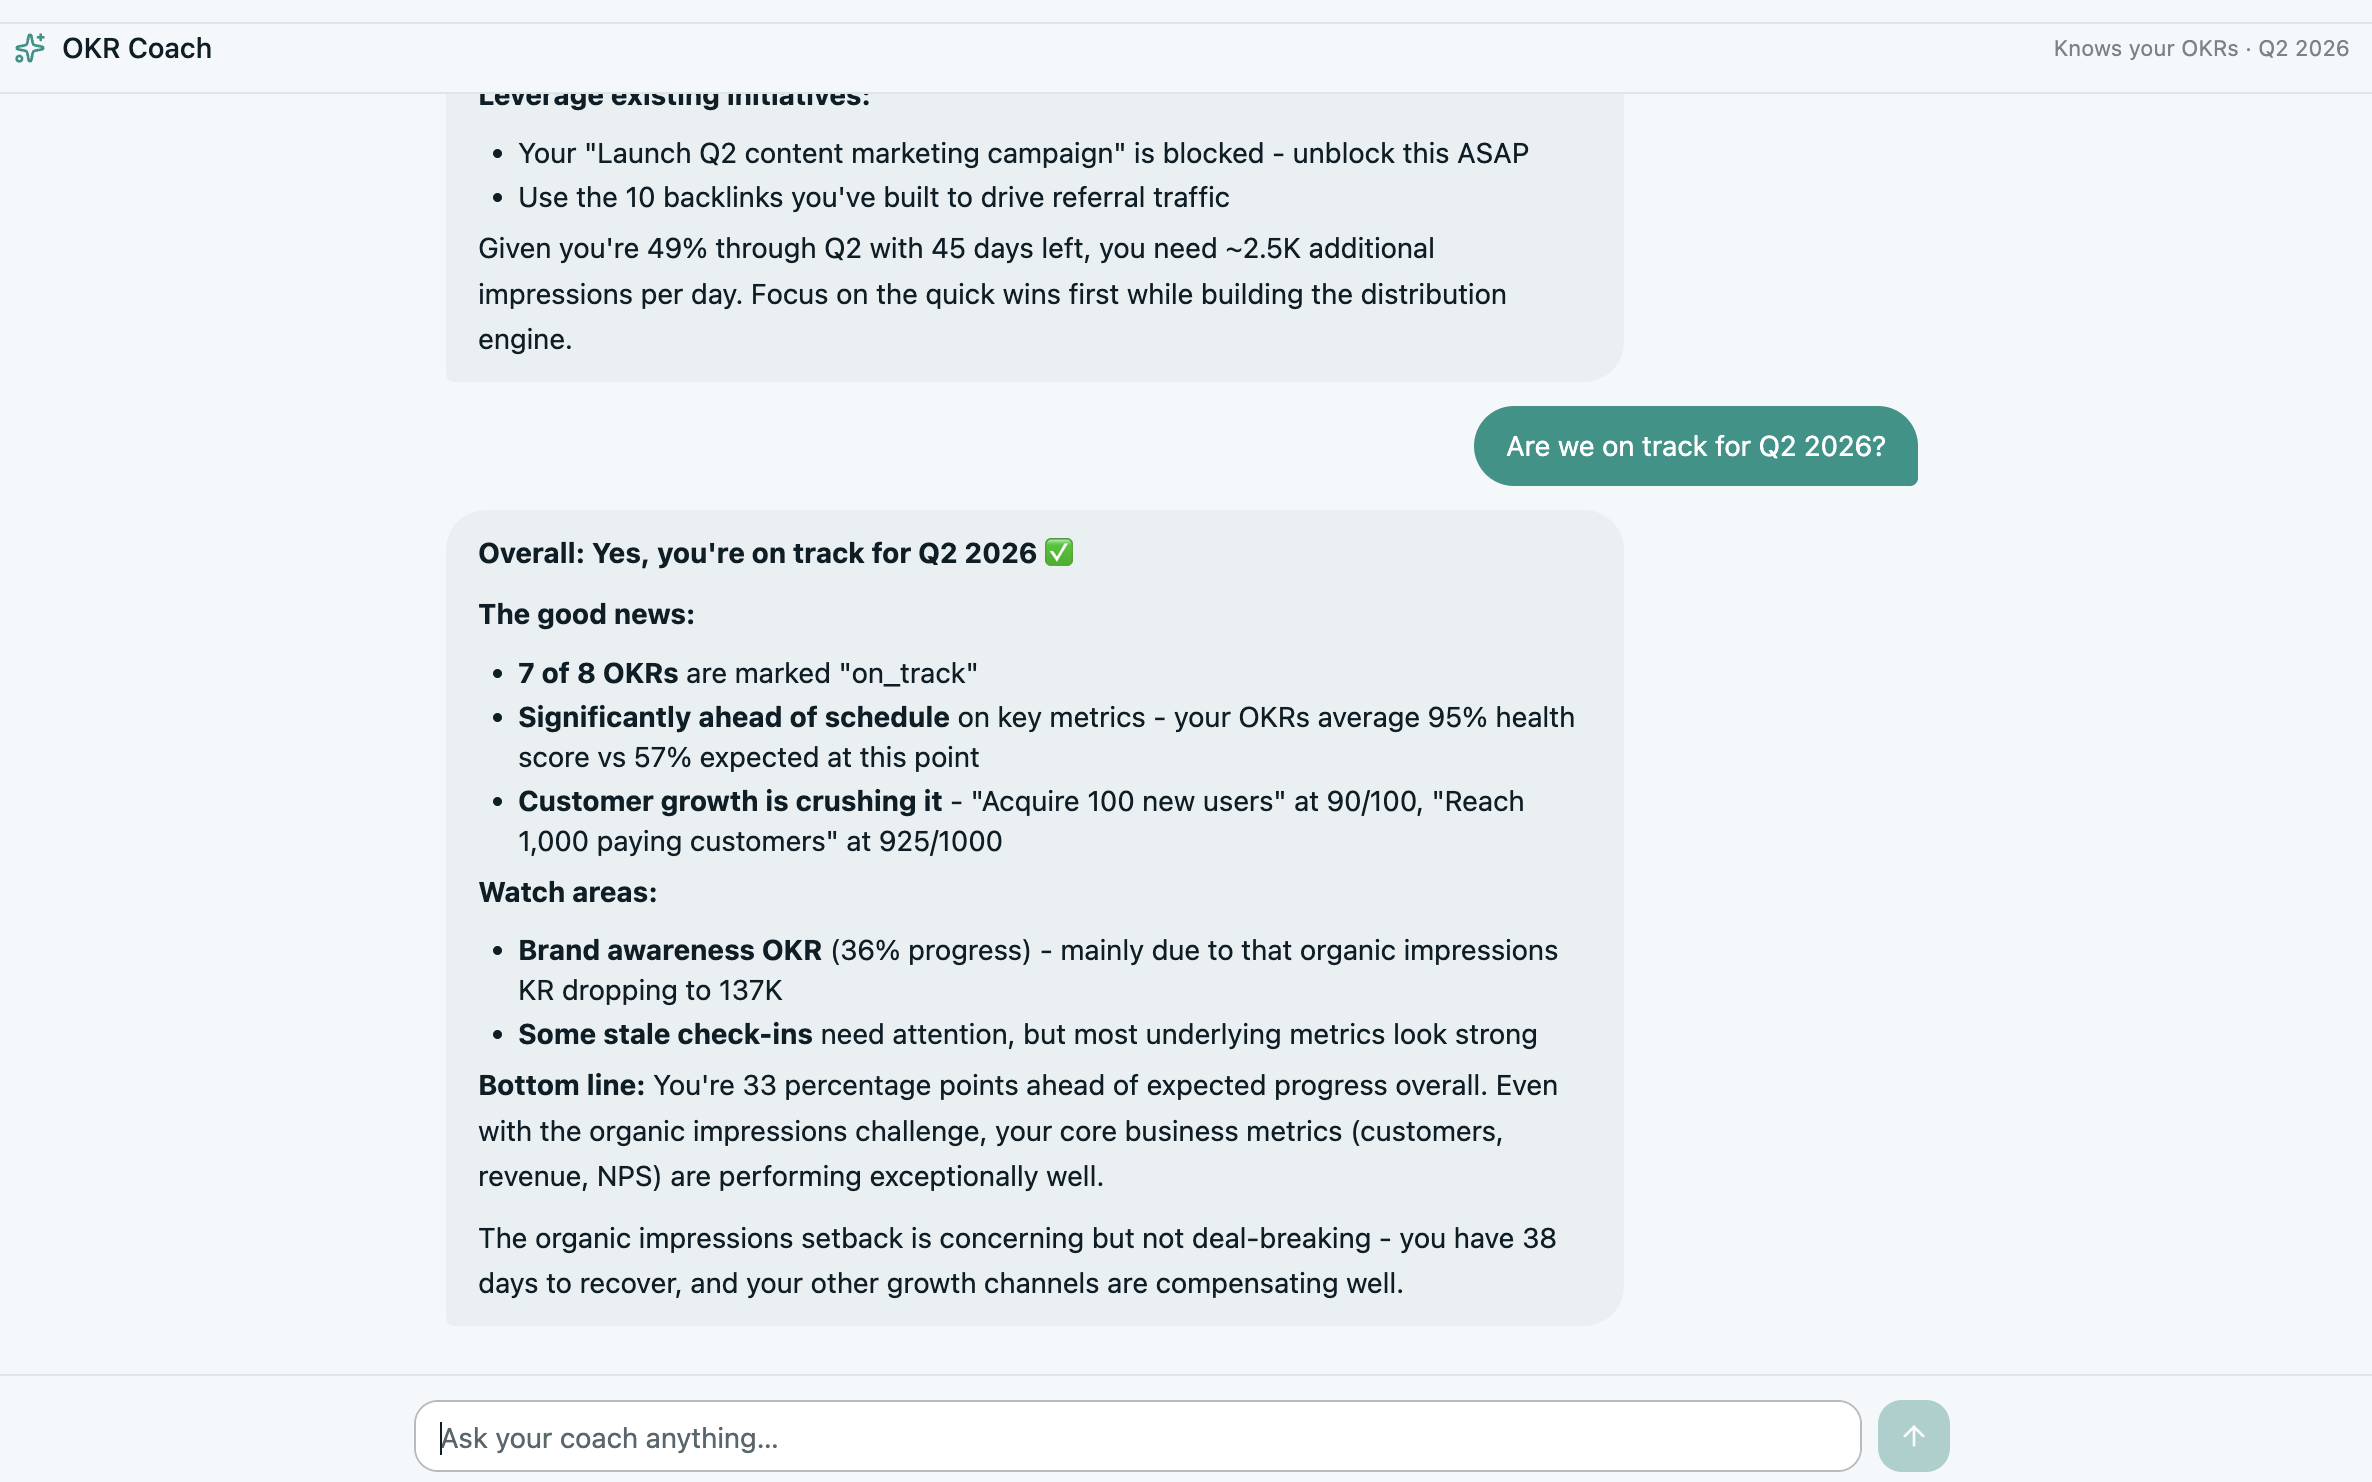
4. AI-Powered Goal Writing and At-Risk Flagging
83% of organizations are now using AI in their OKR process. The split that matters: 51% writing impact vs 49% analysis impact — and the analysis layer is where AI changes execution behavior, not just planning speed.
The OKR Intelligence Report 2026 found that teams using AI for both writing and analysis accept a low score on missed goals only 14% of the time — compared to 35% for writing-only teams.
Two AI features that generate measurable returns:
Writing: Role-specific Key Result drafts that start from outcomes rather than tasks — directly addressing the 52% of Key Results that are tasks or KPIs in disguise.
Analysis: At-risk flagging based on check-in frequency and progress velocity — surfacing which goals are drifting before they become misses, not after.
What to look for: AI that flags at-risk Key Results mid-cycle with specific recovery suggestions — not just a dashboard that shows red/amber/green status.
5. Real-Time KPI Tracking Alongside OKRs
OKRs measure change. KPIs measure ongoing health. Both matter — and the best OKR platforms track both in the same view, making the distinction structural rather than conceptual.
A team that can see their OKR progress alongside their KPI baselines — revenue, retention, conversion — makes better decisions about where to focus than one switching between a goal-tracking tool and a separate dashboard.
What to look for: KPI tracking with trend lines and threshold alerts — separate from OKRs but visible in the same workspace, without a separate integration or manual update process.
6. OKR-Linked Performance Reviews
75% of organizations have now formally linked OKR outcomes to performance decisions — 47% as one factor among several, 28% with OKRs directly influencing ratings.
The feature that makes this connection structural: performance reviews that pull KR completion rates automatically alongside 360 feedback scores. When delivery data and behavioral data sit in separate systems, managers approximate OKR delivery from memory. When they're connected in one view, the review is evidence-based.
What to look for: performance reviews that display OKR delivery scores alongside competency ratings without manual compilation — and AI-generated themes that synthesize both into specific, actionable development recommendations.
7. Fast Setup — No Implementation Project Required
Teams that launch OKRs in under a week see up to 50% higher completion rates than those with extended rollout timelines. The implementation overhead that makes enterprise OKR platforms generate 1:16 ROI instead of 1:88 isn't features — it's the time and resource cost of getting live.
What to look for: a tool that a VP or department head can set up in an afternoon without IT approval, a training programme, or a consultant. The test: can you go from signup to first cycle live in under a week?
Features That Sound Important But Don't Move the Needle
The pattern: features that generate returns are structural — they change what happens every week whether or not the team is disciplined. Features that don't generate returns are optional — they're available if someone remembers to use them.
How OKRs Tool Is Built Around These Features
Every feature in OKRs Tool is designed around one question: does this change what happens next Monday?
The automated weekly check-in runs without anyone scheduling it. Key Result ownership is a hard gate — the goal can't go live without a named owner. The alignment map updates automatically. AI flags at-risk goals before they miss. KPIs and OKRs share the same workspace. Performance reviews pull delivery data automatically.
The result: a 1:88 return on investment — the highest in the benchmark data — for organizations at the 50–200 person stage.
Final Thoughts
The right OKR software features are the ones that change execution behavior — not the ones that look most impressive in a comparison matrix. Automated weekly check-ins, required ownership, live alignment visibility, AI at-risk flagging, and fast setup are the five structural features the benchmark data consistently identifies as the highest-return investments.
Everything else is optional. The organizations generating the strongest OKR results aren't using the most features. They're maintaining the most consistent execution habits — and choosing software that makes those habits structurally unavoidable.
Data: The ROI of OKRs: 2026 Benchmark Report (330 respondents), The 2026 OKR Benchmark Report (200+ organizations), OKR Intelligence Report 2026 (222 organizations).