Companies with a weekly OKR check-in hit their goals very consistently 60% of the time, against 30% for companies checking in monthly. The same pattern runs through 24,000 key result updates, a benchmark of 200 organizations and two leadership surveys: goals that get looked at every week land far more often. Of every OKR habit we've measured, the weekly check-in is the one a team can least afford to skip.
A monthly review gives a quarter three chances to catch a key result going wrong, while a weekly check-in gives it twelve. That arithmetic is the simplest version of the argument for a weekly rhythm, and the data behind it turns out to be stronger than the arithmetic suggests.
This piece brings together everything we've measured on check-ins: 24,000 key result updates on the OKRs Tool platform, the OKR Benchmark Report, a study of 420 companies of 50–200 people, and surveys of operations and strategy leaders. Every source points the same way, which is why the weekly check-in sits at the top of the list of OKR habits a team shouldn't trade away when the quarter gets busy.
Weekly Teams Hit Their Goals Twice as Often
The cleanest comparison comes from the Growing Pains of OKRs study of 420 companies of 50–200 people, which set weekly check-ins against monthly ones.
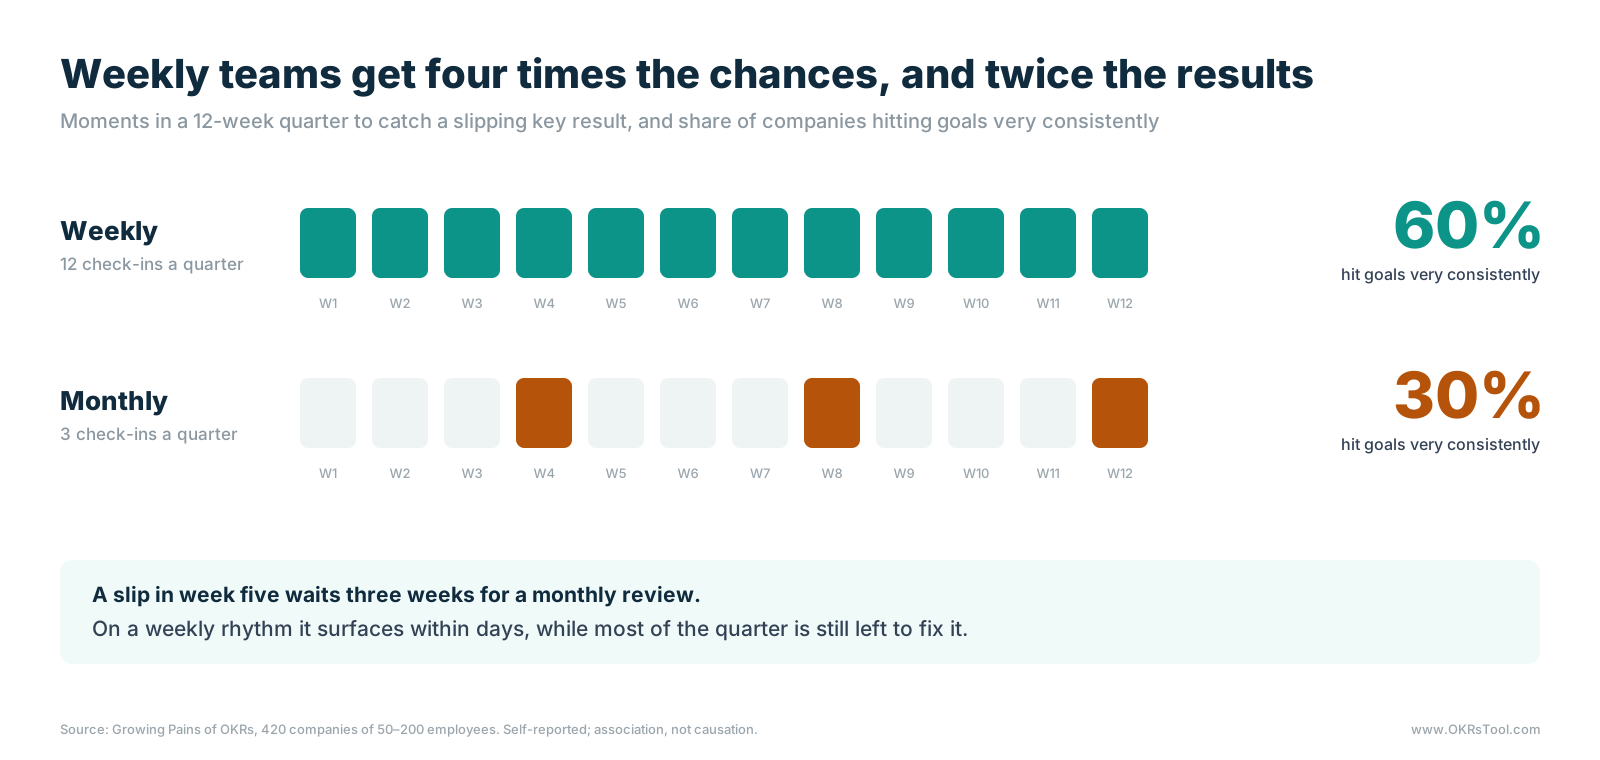
Companies with a weekly check-in hit their goals very consistently 60% of the time, against 30% for monthly companies, so the weekly rhythm doubles the odds on its own. The OKR Benchmark Report found the same direction from a different angle: teams reviewing OKRs weekly complete 43% more of them than teams reviewing monthly or ad hoc, and teams that skip check-ins entirely are three times more likely to abandon OKRs altogether.
The mechanism is detection time. A key result that slips in week five gets noticed within days on a weekly rhythm, while a monthly review leaves it alone until week eight, by which point a third of the recovery time has gone. A weekly check-in cadence keeps every goal inside that short detection window for the whole quarter.
What a Weekly Check-In Does to a Key Result
The survey figures describe teams. The platform data shows what happens to individual key results, because every update is timestamped.
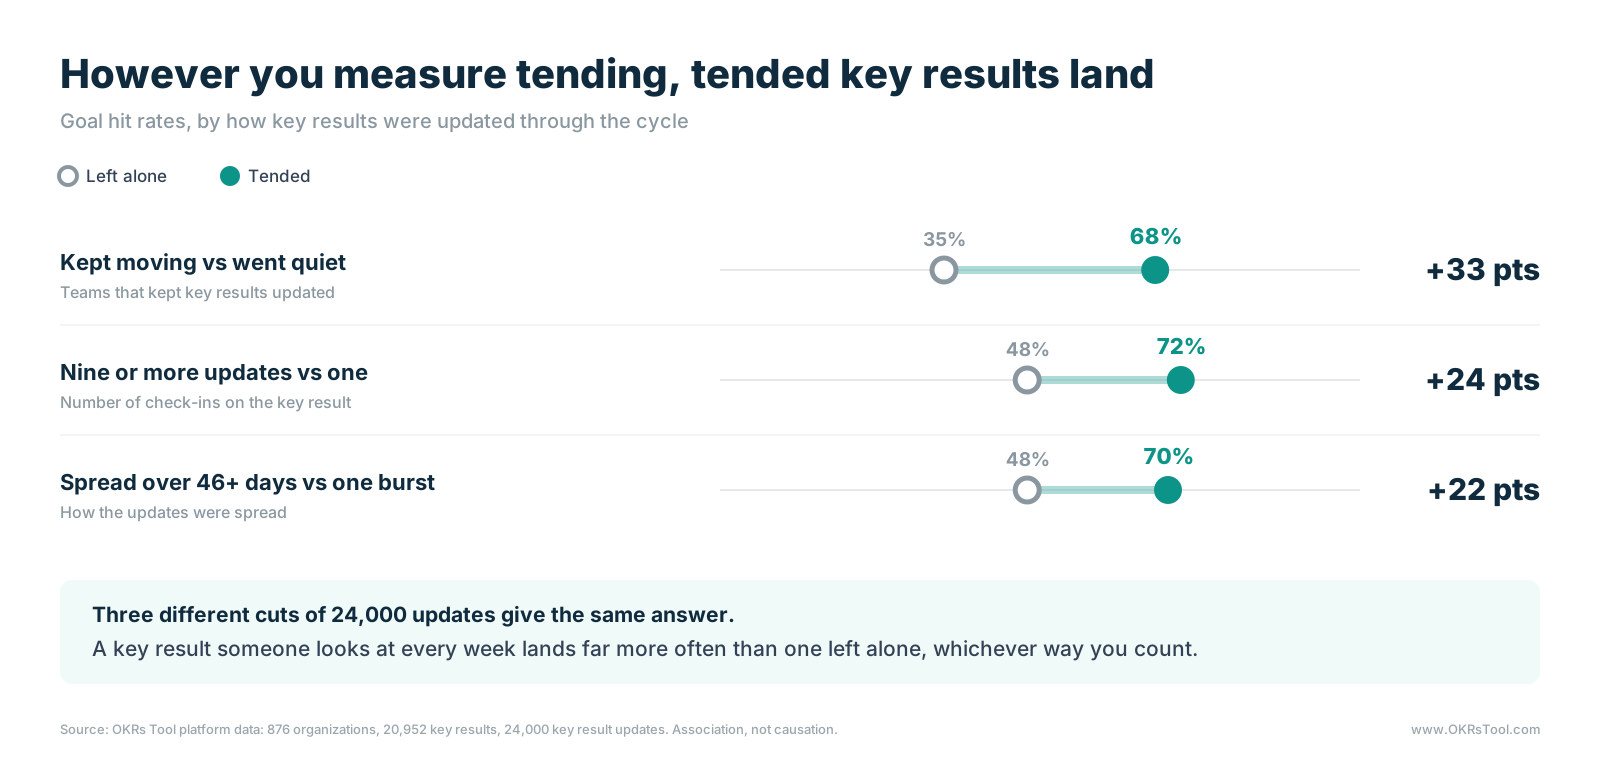
Across 876 organizations in OKRs Tool platform data, teams that kept their key results moving through the cycle hit their goals 68% of the time, against 35% for teams whose key results went quiet. At the level of single key results, those checked in once hit their target 48% of the time, rising to 72% for those checked in nine times or more. Spacing matters as well: key results updated steadily across 46 days or more hit 70% of the time, against 48% for those updated in a single burst, which is what a last-minute catch-up before a review looks like in the logs.
The value comes from the owner looking. A weekly check-in makes someone notice a stall and ask why while there's still time to respond, and that's the behavior the timestamps reward.
The Early Check-Ins Decide What Can Be Saved
The first few check-ins of a quarter carry more weight than the rest. In the OKR Pacing Benchmark, a key result that had already moved at its first check-in went on to hit its target 62% of the time, against 27% for one still at zero. By week four, key results at 50% or more hit their target 84% of the time, against 55% for those below halfway.
A zero at the first check-in can still be recovered, provided the goal stays in the weekly rhythm. Of key results stuck at zero at their first check-in, 35% never received another update and finished at zero. Those that kept getting check-ins hit their target 42% of the time, and the ones that started moving before the mid-quarter review recovered 66% of the time, against 47% after it. The weekly check-in is what keeps a stalled goal visible long enough to be rescued.
Why Goals Go Quiet
Goals fade when no rhythm keeps them in front of anyone, and that slow silence is the most common way an OKR program comes apart.
The clearest evidence is the difference between solo workspaces and teams. A solo workspace logs one update for the entire cycle and then goes dark, while a full team logs 5.5. Only 30% of solo workspaces touch a single key result all cycle; with two to four people, the share more than doubles to 61%, and a full team reaches 91%.
A goal held by one person has nobody to report to, so it stalls, while a goal shared across a team gets a weekly moment where someone asks about it. That's also why team OKRs need the rhythm, whether the team is one department or the whole company.
The cost shows up at the organization level. In the August 2026 platform export of 29,987 key results, top-quartile organizations left a median of 8% of their key results at zero for the whole cycle, while bottom-quartile organizations left 56%, more than half of everything they set. A weekly check-in makes that kind of abandonment visible within days.
A Check-In Needs an Owner, a Score and a Live Number
A check-in only produces signal if three things are in place, and each one shows up separately in the data.
An owner. Teams with one clear owner per key result complete 26% more of their goals, and in the 420-company study, companies with an owner on every OKR hit their goals very consistently 65% of the time, against 17% where only some had one. Ownership puts one name against every number, so the check-in has a specific person, a specific number and a specific reason it moved or didn't.
A score. Companies that put a confidence score on every key result at each check-in hit their goals very consistently 66% of the time, against 22% for those that score only some. The score is where an owner says whether the key result is on track, which is the part of a check-in a leadership team can act on.
A live number. Companies that update progress as it happens hit their goals very consistently 59% of the time, while companies that rebuild the picture the night before a review hit 28%. A weekly check-in run from live numbers is the first kind; a check-in assembled from memory drifts toward the second.
Put together, the three parts look like this in a single check-in.

Honesty Makes the Check-In Worth Having
A check-in only produces real signal if people tell the truth in it, and the research on what people do is sobering. The State of Goal Management found that 92% of employees admit to at least one form of goal-gaming. 70% have reported a goal as healthier than they knew it to be, the watermelon effect of green on the surface and red underneath, and 43% admit to sandbagging, inflating status and writing goals to impress, all at once.
The platform data offers some reassurance here. Among key results with eight or more weeks of history, 46% were revised downward at least once, and they hit their target 68% of the time, against 72% for key results whose progress only went up. Correcting a number in a check-in carries almost no penalty.
The OKR Benchmark adds that 72% of high-performing teams work where missing a goal feels at least somewhat safe, so psychological safety is a precondition for check-ins worth holding. An off-track key result raised in week four is a gift, and the same key result hidden until week eleven becomes a crisis.
Where Teams Let the Habit Slip
Agreement that weekly check-ins matter is easy to find. Running them every week is where teams fall short. In the Goal-Setting Benchmark, only 36% of teams that described their goal process as consistent reviewed progress weekly, and 35% updated their goals only before a review.
The gap is expensive. 59% of leaders in the same survey lose an hour or more a month chasing goal status, and the leaders who chase most reported 51% of goals on track, against 67% for those who chase least. Further up, the Strategy Execution Benchmark found that 21% of leaders take a month or more to learn a priority is off track, and 83% get no automatic signal when one slips.
The weekly check-in has a limit worth stating. The Goal-Setting Benchmark found that weekly review didn't protect teams from misses caused by shifting priorities (47% against 51%), and "priorities shifted" was the most common reason goals were missed. A check-in catches drift; a change in direction still needs a deliberate decision about adjusting OKRs, usually at the mid-quarter review.
Keep the Meeting Short and the Habit Constant
The OKR Benchmark found that completion peaked when check-in meetings ran 15 to 20 minutes, and that teams whose meetings ran 45 minutes or more did worse. More recent data from the 420-company study adds a nuance: at companies of 50–200 people, the teams investing two hours or more a week in OKRs overall were the ones most likely to hit their goals. The two findings fit together once the meeting and the habit are separated, because the meeting should stay short while the updating, scoring and follow-up around it get the time they need.
The agenda that produces the lift is four questions, in order, inside 20 minutes for a team of six to eight: what moved (the number, not the story), what's blocked or at risk and who acts, what the one or two priorities are this week, and whether every key result still has an owner moving it. The weekly check-in template sets that out as a format a team can copy.
Every Data Source Points the Same Way
The table brings the findings together by source.
Make the Weekly Check-In Non-Negotiable
The habit compounds. Teams in their first or second cycle complete 51% of their OKRs, rising to 59% by cycles three and four and 79% by cycle five and beyond on the OKR maturity curve. In the 420-company study, companies running none of the core four habits (weekly check-ins, real-time tracking, full ownership and consistent retros) hit their goals very consistently 10% of the time, while companies running all four reached 80%, and the weekly check-in is the habit the other three depend on.
For the person accountable for OKRs, that makes the weekly check-in the one commitment to protect when everything else gets cut. It costs one short meeting a week and a few minutes per owner, and it decides whether the end-of-quarter score is a surprise. A platform that sends every owner a weekly reminder in Slack or Microsoft Teams, asks for a confidence score and keeps progress live on an OKR dashboard keeps the habit running in the weeks when nobody has time to chase it.
Data: OKRs Tool platform data (876 organizations, 7,419 objectives, 20,952 key results and 24,000 key result updates, the OKR Pacing Benchmark; The OKR Benchmark Report (200 organizations); the Growing Pains of OKRs study (420 companies of 50–200 employees); The Goal-Setting Benchmark (280 leaders) and the Strategy Execution Benchmark (180 leaders).