The goal setting strategies that move completion are structural, not editorial. Ownership, cadence, visibility, and honesty are what separate teams completing 79% of their goals from teams stuck at 51% — three structural habits alone lift completion by 26–50%, and none of them changes how a goal is worded.
Nearly every list of goal setting strategies is about wording: how to phrase an objective, how to make a target measurable, how to write a key result that isn't vague. The data says the wording is rarely where goals fail. Teams write perfectly reasonable goals and then miss them anyway, because nothing structural carries the goal from the planning document into the week.
The evidence for that is blunt. The State of Goal Management surveyed 210 employees and found 34% say nothing about how they work would change if their goal tracker were deleted tomorrow. The goals exist, they get updated, and they influence nothing — which is a structural failure, not a writing one. The eight goal setting strategies below cover both halves: what to write, and the system that makes the writing matter.
The Structure Matters More Than the Wording
Before the eight strategies, the finding that reorders all of them: the biggest gains in goal completion come from structure, not from language.
Three structural habits — launching fast, checking in weekly, naming one owner — lift completion by 26 to 50%, and none of them touches how a goal is phrased. The clearest way to see why structure beats wording is to look at how teams find out a goal is drifting in the first place.
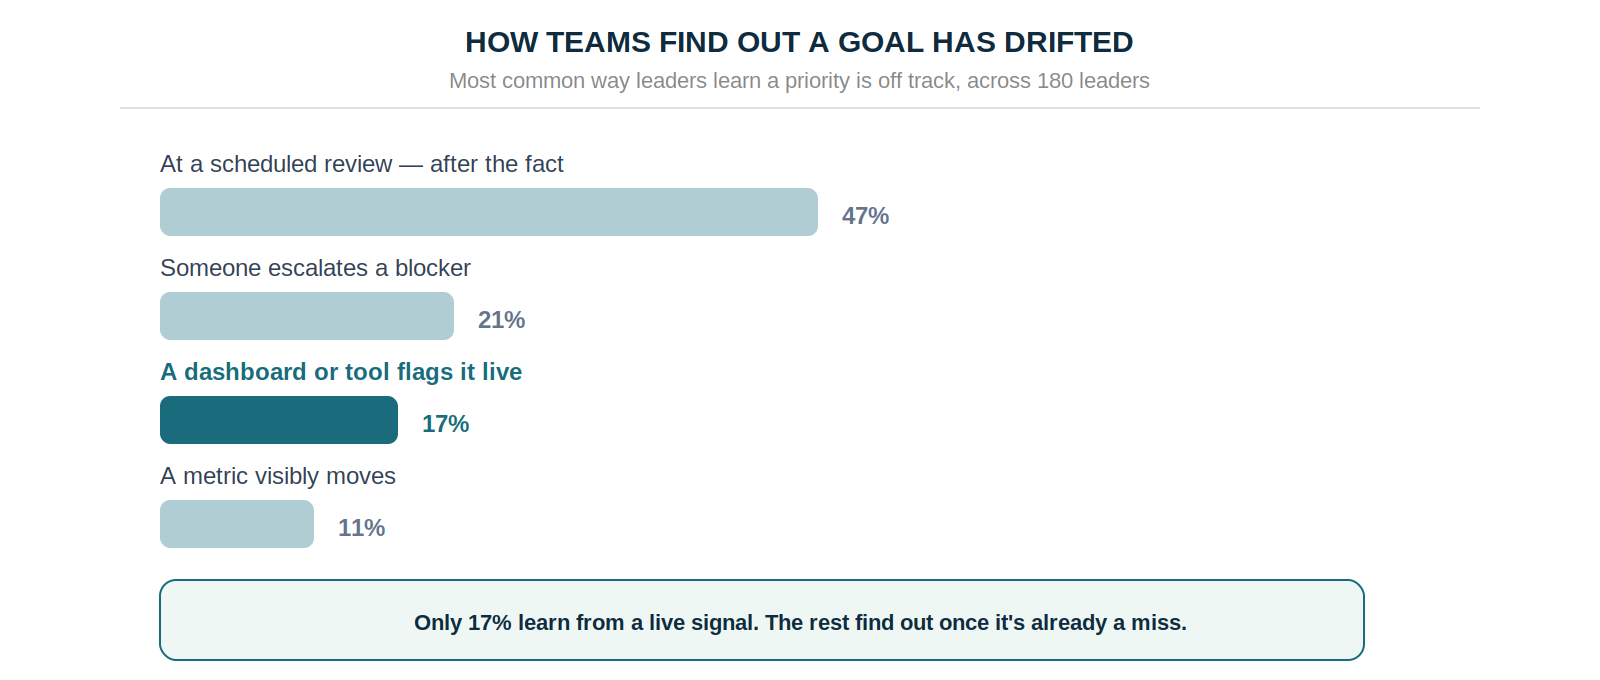
Only 17% of leaders find out from a live signal; nearly half learn at a scheduled review, once the miss has already happened. That's the lens for everything below: the writing strategies matter, but they're the smaller half. Get the structure right and mediocre goals still get hit; get it wrong and beautifully written ones still drift.
Strategy 1: Write Outcomes, Not Activities
The first goal setting strategy is the most fundamental, and most teams get it wrong. Across 20,952 key results analysed on the OKRs Tool platform, output verbs — launch, complete, deliver, implement — appeared in 52% of them. Outcome verbs — increase, reduce, achieve, grow — appeared in only 34%.

A task describes work done; an outcome describes something that changed. "Launch the new onboarding flow" can be marked complete while the metric it was meant to move stays flat. "Increase trial-to-active conversion from 25% to 40%" can't be gamed that way — the number moved or it didn't. The test for any key result: can you mark it complete without a business metric moving? If yes, it's a task, and it needs rewriting as the outcome the task was meant to produce.
The formula is simple — improve [metric] from [baseline] to [target] by cycle end — and the full writing guide covers it with examples across every function. The baseline isn't optional: without it, there's no honest way to score the result at cycle end.
Strategy 2: Name One Owner Before the Cycle Starts
Half of all key results across growing organizations have no named owner, and teams that require a single owner per key result complete 26% more of them than teams with shared or vague accountability.
Shared ownership is the most common and most fixable failure in goal setting. Split a goal between two people and accountability evaporates — each assumes the other has it. The fix is mechanical: nothing goes live without one named person — not a team, not "leadership" — whose name sits beside the progress score every week. Pair that with restraint on volume: past four or five key results per objective, focus dilutes and ownership diffuses at the same time.
The right question at the planning session isn't "what does everything we want to achieve look like?" It's "which two or three outcomes, if we moved them this quarter, would make everything else less important?" Answering that honestly is the goal setting discipline that matters most, and it's the same logic behind limiting how many goals a team runs.
Strategy 3: Check In Every Week Without Exception
Teams that check in weekly complete 43% more of their goals than teams reviewing monthly or ad hoc. It's the single highest-leverage habit in this list, and it doesn't require a meeting — five minutes per person on four questions: what moved, what's blocked, what's the priority this week, where is help needed.
What isn't flexible is the cadence. The weekly check-in has to happen regardless of how busy the quarter gets, because the weeks it feels most skippable are usually the weeks a goal has quietly started drifting. Weekly beats monthly not because each session is better, but because it surfaces problems while they're still recoverable — drift caught in week four can be corrected; the same drift found in week eleven is a post-mortem. Monthly tracking turns goal management into autopsies; weekly turns it into steering.
Purpose-built goal tracking software automates the cadence — a nudge via Slack or Teams that fires every week without anyone scheduling it. Organizations on purpose-built platforms report a 1:88 return against 1:25 on spreadsheets, largely because the weekly habit becomes structural rather than a test of discipline.
Strategy 4: Make Goals Visible and Nameable
A goal nobody can name can't be pursued, and visibility is the earliest warning that a goal system has gone decorative. Among the 210 employees surveyed, the ones who couldn't name their company's goals were dramatically more likely to say deleting the tracker would change nothing — the recall problem and the relevance problem are the same problem.
Visibility doesn't come from a strategy document or an all-hands slide. It comes from goals appearing in the tools people already use — the Slack channel, the weekly dashboard, the check-in flow. 65% of teams admit their goals aren't clearly linked to company strategy, usually because the cascade from company objective to team key result was never made structural. Fix that — every team key result cascaded from a company objective before the cycle starts, visible in the tool people open daily — and the recall problem disappears on its own.
Strategy 5: Decouple Goals From Performance Ratings
The State of Goal Management found 92% of employees admit to at least one form of goal-gaming — sandbagging a target they've mostly hit, reporting a goal healthier than it is, or writing goals to impress rather than to change anything. Only 8% say they've never done any of it.
The behaviour intensifies when goals feed performance ratings. The mechanism most organizations use to make goals "count" is the same one that teaches people to manage appearances instead of outcomes: tie a missed goal to a performance mark and the rational move is to set a target at 90% of what the team is already doing, then call a 1.0 at cycle end. The fix is structural.
Scoring on a 0.0–1.0 scale with a 0.7 target exists to make ambition safe — a 0.7 is a strong result, not a failure. Use goal data as one signal among several in a performance review, never as the determining input.
Strategy 6: Launch Before the Quarter Gets Loud
Teams that launch within one week of quarter start see up to 50% higher completion than teams taking two to four weeks. The reason isn't that fast planning produces better goals — it's that teams launching late spend the opening weeks in an ambiguous state where some key results are live and some aren't, some owners are named and some aren't. That ambiguity kills the weekly check-in habit before it forms.
A clean launch produces a different state entirely: cascade complete, every owner named, the first check-in already on the calendar. The planning session doesn't need to be elaborate — one half-day, company objectives set, team key results drafted in parallel, every one with an owner before the room empties. The cascade should finish before the cycle starts, not three weeks into it.
Strategy 7: Score Honestly — 0.7 Is the Target
Teams in their first cycles average 51% completion; by cycle five that rises to 79% — a lift that compounds from the discipline of honest scoring rather than from easier targets. Where that discipline is enforced turns out to matter more than most teams expect.
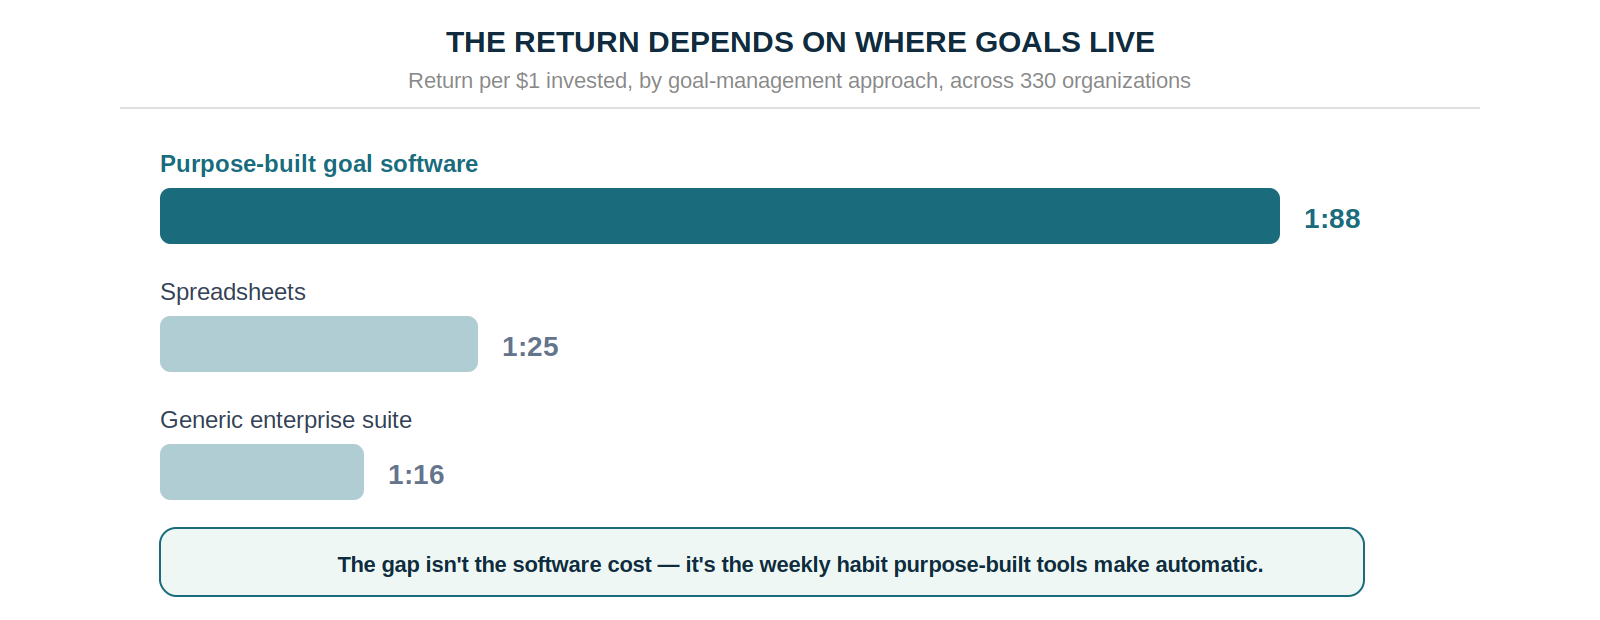
Purpose-built goal software returns 1:88 against 1:25 on spreadsheets and 1:16 on a generic enterprise suite — not because the software is better at scoring, but because it makes honest, consistent scoring the path of least resistance.
Honest scoring is what makes that compounding possible — and the tell is what a team does with a 1.0. Scoring the top of the scale on everything isn't excellence; it means the targets were set too low to learn anything from.
A 0.65 in cycle one, scored accurately and diagnosed in the retro, produces a sharper cycle two. An inflated 0.9 that hides a miss carries the same problems into the next cycle untouched.
The discipline that matters at mid-cycle: every off-track key result leaves the mid-quarter review with one of three outcomes — revised target, escalated blocker, or formally closed. Naming the outcome is what separates a managed miss from a goal that just vanishes
Strategy 8: Give Every Goal a Real Ending
Teams that run structured end-of-cycle retrospectives complete 30–45% more goals the following quarter. What divides a load-bearing goal system from a decorative one is whether goals get a real ending, not how they get set.
A real ending has three parts: honest scoring on the 0.0–1.0 scale for every key result, not a narrative of "we basically got there"; a structured retrospective naming what drove progress, what blocked it, and what structural change would produce a different result next cycle; and explicit commitments — three specific things that will change in the next planning session — written down before the retro ends.
The retrospective is the piece teams skip when the quarter gets busy, and that decision compounds. Teams that skip cycle one's retro enter cycle two without the data to improve, and they're the teams still near 51% while the disciplined ones reach 79%.
The 8 Goal Setting Strategies at a Glance
The Strategies Compound — Start With Structure
The eight goal setting strategies aren't independent techniques; they're a connected system. Outcome-based key results only produce honest signals if someone owns them. Ownership only produces accountability if progress is visible weekly. Weekly visibility only produces intervention if a mid-cycle review acts on what it surfaces. And all of it only compounds if every cycle ends with an honest retrospective feeding the next planning session.
Teams that adopt one or two of these in isolation see marginal improvement. Teams that adopt all eight climb the 51%→79% curve — not because any single strategy is powerful, but because they reinforce each other. The weekly check-in makes ownership visible; honest ownership makes watermelon reporting harder; decoupling from ratings makes honest scoring rational; honest scoring makes the retrospective valuable; a valuable retrospective sharpens the next cycle's goals.
So start with the structure — named ownership, weekly cadence, cascade alignment — before touching the goal language. Across 200 organizations the gap between a 1:25 and a 1:88 return traces to structural discipline applied cycle after cycle, not to sharper wording.
Which is the quiet lesson underneath all eight: a goal is only ever as good as the system carrying it into the week. Write the best objective in the company, and without an owner, a cadence, and an honest ending, it decays into the 34% that would change nothing if you deleted it tomorrow. The eight strategies function as scaffolding: they decide whether a goal survives contact with a busy quarter, which is a separate question from how well it was written.
Data: The 2026 OKR Benchmark Report (200 organizations), OKRs Tool platform data (876 organizations, 20,952 key results), The State of Goal Management (210 full-time employees at growing companies).