24 SMART goals examples for work, grouped by function and written against all five criteria — plus the one thing most goals get wrong.
Steven Macdonald
5 Mins read
September 6, 2026
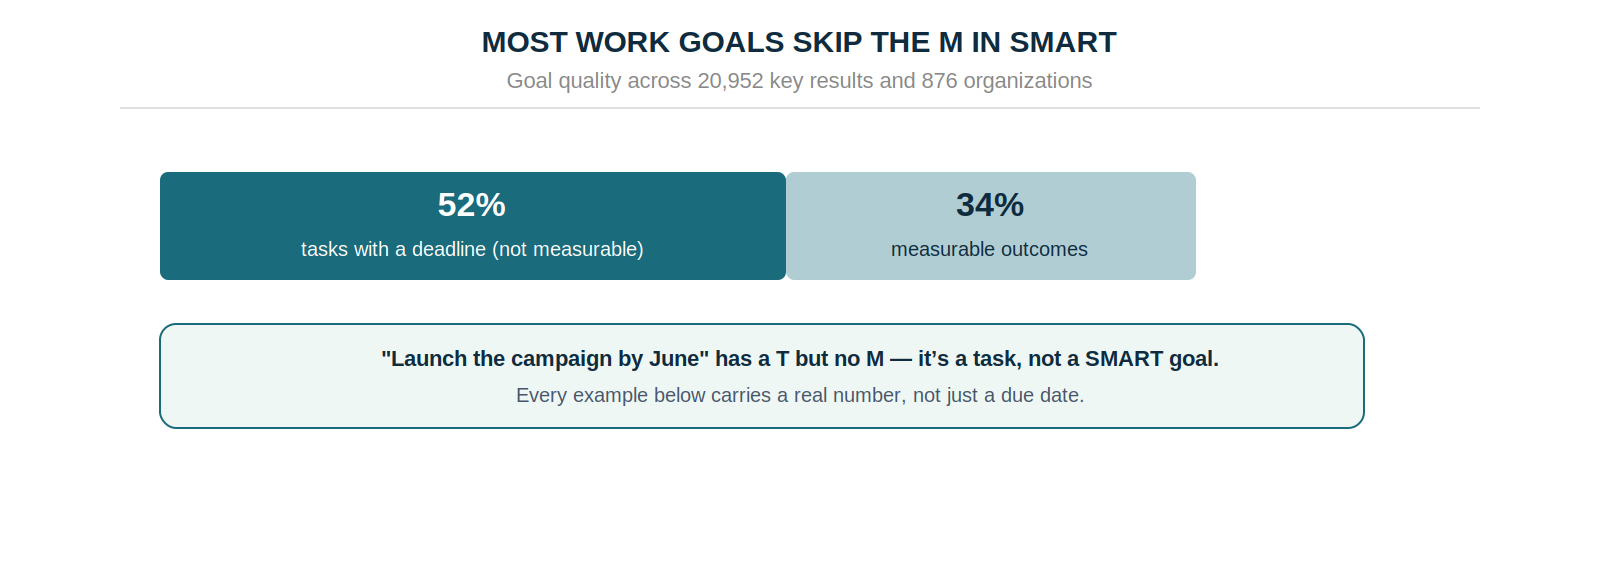
A goal that calls itself SMART usually only manages the T — it names a deadline and skips the number. Across 20,952 real goals, 52% turned out to be tasks with a due date rather than anything measurable. These 24 SMART goals examples are written the other way: every one carries a baseline and a target, so you can tell at a glance whether it was hit.
Good SMART goals examples are surprisingly rare, because the SMART framework is nearly fifty years old and almost everyone can recite the acronym — specific, measurable, achievable, relevant, time-bound — yet few goals actually pass it. Yet most goals written under its banner quietly fail the second letter. "Launch the new onboarding flow by June" feels SMART because it has a deadline, but it has no number: it's done the moment the flow ships, whether or not anything improved. That's a task with a date on it, not a goal you can score.
SMART is the most-used approach there is — the Goal-Setting Benchmark puts it at 39% of teams, well ahead of any other framework. That popularity is exactly why the examples matter: more teams run SMART than anything else, yet few of those goals actually pass the M. The ones below are written to.
The examples below fix that. Each is written against all five criteria, with the measurable part doing real work — a movement from a starting point to a target, inside a window. They're grouped by the eight functions most teams organize around, so you can lift the ones that fit and swap in your own baselines.
Turn these goals into ones your team tracks
OKRs Tool gives every goal a baseline, a target, an owner, and a weekly check-in — so a SMART goal actually moves. Free for up to 5 users.
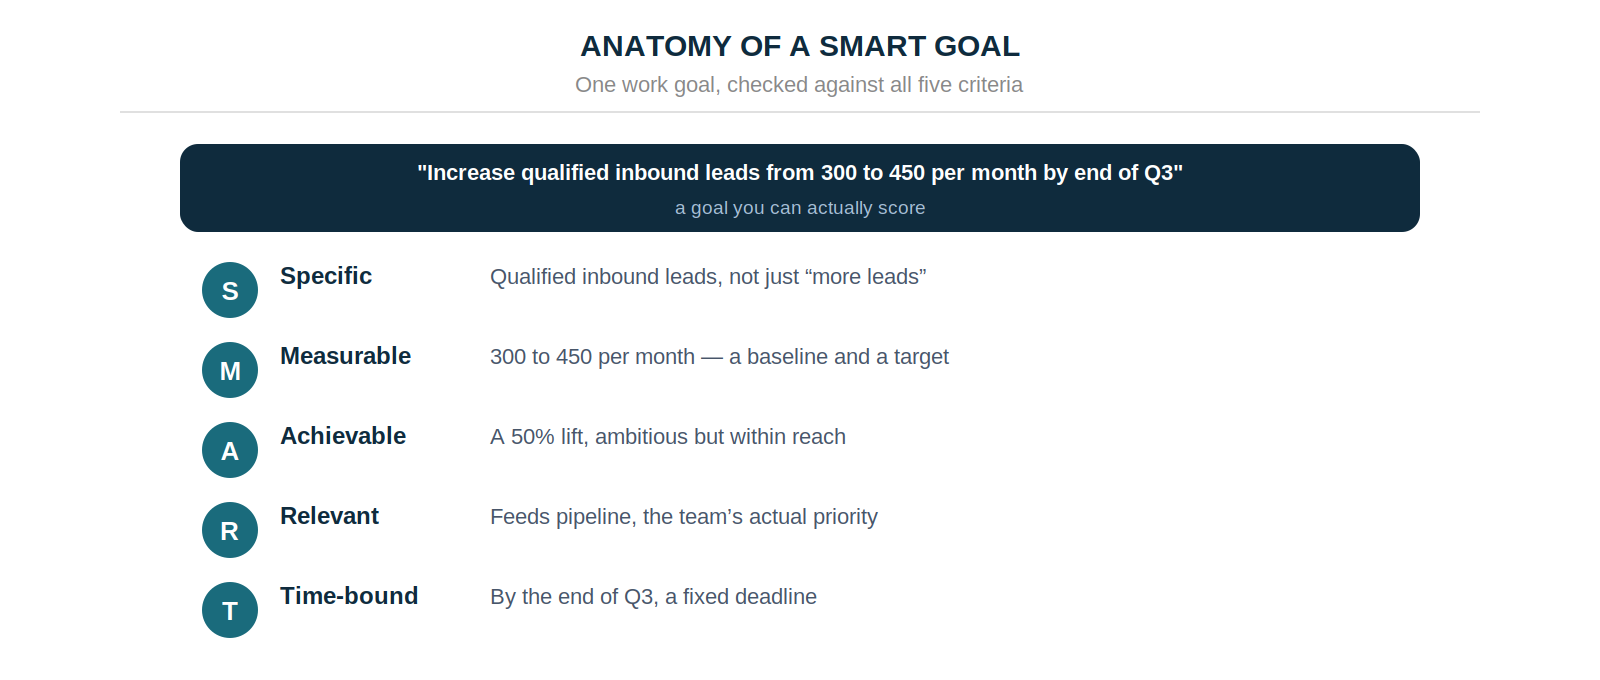
The acronym is a checklist, and a goal is only SMART if it passes all five. Specific means it names one clear outcome, not a vague direction. Measurable means a number with a baseline and a target. Achievable means a stretch you could realistically hit. Relevant means it connects to a priority that matters. Time-bound means a fixed deadline.
Reading the criteria as a strict checklist is what separates a real goal from a wish. "Get better at onboarding" fails Specific and Measurable. "Improve onboarding by June" adds the T but still has no number.
Only "raise Day-7 activation from 34% to 52% by June" clears all five — it names the exact outcome, gives a baseline and a target, sets a reachable stretch, ties to a priority, and fixes a date. The discipline is in refusing to call anything a goal until it survives all five tests, and the criterion that trips most people is the second one.
The letter that gets skipped is almost always the M. It's the hardest to write, because a measurable goal can fail — and a vague one never technically does.
Why "SMART" Goals Skip the M
The gap between reciting the acronym and applying it shows up clearly in real goal data at scale, where the measurable criterion is the one most often missed.
Across 20,952 key results, 52% were activities with a due date rather than measurable outcomes. A goal that reads "roll out the new tool by Q2" satisfies the T and nothing else. The fix is to ask what the rollout is meant to change, and make that number the goal — which is exactly the difference between a task and a real measurable goal. It's also why teams increasingly frame these as OKRs rather than plain SMART goals. Every example that follows carries that number.
24 SMART Goals Examples, by Function
Grouped across the eight functions most teams organize around — marketing, sales, product, operations, HR, and engineering. Each goal is written against all five SMART criteria, with a baseline and a target you can adapt to your own numbers.
Marketing3 goals
Goal 1
SMART GoalIncrease qualified inbound leads from 300 to 450 per month by the end of Q3.
S — Specific: qualified inbound (marketing-qualified) leads, not general traffic
M — Measurable: from 300 to 450 leads per month
A — Achievable: a 50% lift on an already-performing channel
R — Relevant: directly feeds the sales pipeline target
T — Time-bound: by the end of Q3
Goal 2
SMART GoalRaise the blog-to-signup conversion rate from 1.8% to 3.0% by the end of Q2.
S — Specific: the blog-to-signup conversion rate
M — Measurable: from 1.8% to 3.0%
A — Achievable: a realistic lift through CTA and page testing
R — Relevant: improves the top of the signup funnel
T — Time-bound: by the end of Q2
Goal 3
SMART GoalGrow the newsletter to 8,000 subscribers while keeping open rate above 35%, by December 31.
S — Specific: engaged newsletter subscribers, with a quality guardrail
M — Measurable: reach 8,000 subscribers at a 35%+ open rate
A — Achievable: steady growth from the current 5,000 base
R — Relevant: builds an owned audience for demand gen
T — Time-bound: by December 31
Sales3 goals
Goal 4
SMART GoalClose $850K in new ARR at a win rate of 30% or higher by the end of the quarter.
S — Specific: new annual recurring revenue at a defined win rate
M — Measurable: $850K new ARR, win rate ≥ 30%
A — Achievable: in line with current pipeline coverage
R — Relevant: the team's primary revenue target
T — Time-bound: by the end of the quarter
Goal 5
SMART GoalShorten the average sales cycle from 34 days to 25 days by the end of Q2.
S — Specific: the average deal cycle length
M — Measurable: from 34 days to 25 days
A — Achievable: through tighter qualification and follow-up
R — Relevant: faster cycles lift overall capacity
T — Time-bound: by the end of Q2
Goal 6
SMART GoalRaise the demo-to-close rate from 15% to 22% by the end of the quarter.
S — Specific: the demo-to-close conversion rate
M — Measurable: from 15% to 22%
A — Achievable: via structured discovery and objection handling
R — Relevant: improves return on every demo booked
T — Time-bound: by the end of the quarter
Product3 goals
Goal 7
SMART GoalIncrease Day-7 activation from 34% to 52% by the end of the quarter.
S — Specific: Day-7 activation rate for new users
M — Measurable: from 34% to 52%
A — Achievable: through onboarding improvements already scoped
R — Relevant: activation is the strongest retention lever
T — Time-bound: by the end of the quarter
Goal 8
SMART GoalCut median time-to-first-value from 6 days to 2 days by the end of the quarter.
S — Specific: median time-to-first-value for new accounts
M — Measurable: from 6 days to 2 days
A — Achievable: by removing setup friction
R — Relevant: faster value drives conversion and retention
T — Time-bound: by the end of the quarter
Goal 9
SMART GoalGrow adoption of the new reporting feature from 12% to 40% of active accounts within 90 days.
S — Specific: adoption of the new reporting feature among active accounts
M — Measurable: from 12% to 40%
A — Achievable: with in-app prompts and enablement
R — Relevant: proves the feature investment paid off
T — Time-bound: within 90 days
Operations3 goals
Goal 10
SMART GoalCut average order-to-ship time from 48 hours to 18 hours by the end of Q3.
S — Specific: average order-to-ship time
M — Measurable: from 48 hours to 18 hours
A — Achievable: through process and staffing changes
R — Relevant: delivery speed is a competitive lever
T — Time-bound: by the end of Q3
Goal 11
SMART GoalLower fully-loaded cost per order from $14.20 to $10.50 by the end of Q4.
S — Specific: fully-loaded cost per order
M — Measurable: from $14.20 to $10.50
A — Achievable: via automation and reduced overtime
R — Relevant: directly improves unit economics
T — Time-bound: by the end of Q4
Goal 12
SMART GoalReduce the defect rate from 4.5% to under 1.5% by December 31.
S — Specific: the process defect rate
M — Measurable: from 4.5% to under 1.5%
A — Achievable: through QA and root-cause fixes
R — Relevant: quality drives reliability and cost
T — Time-bound: by December 31
HR & People3 goals
Goal 13
SMART GoalReduce voluntary team turnover from 22% to under 12% over the next 12 months.
S — Specific: voluntary turnover on the team
M — Measurable: from 22% to under 12%
A — Achievable: through retention and engagement work
R — Relevant: turnover is costly and disruptive
T — Time-bound: over the next 12 months
Goal 14
SMART GoalCut average time-to-fill for key roles from 55 days to 35 days by the end of Q3.
S — Specific: time-to-fill for key (priority) roles
M — Measurable: from 55 days to 35 days
A — Achievable: with a stronger pipeline and faster loops
R — Relevant: open key roles slow the whole company
T — Time-bound: by the end of Q3
Goal 15
SMART GoalRaise the team engagement score from 6.8 to 8.2 out of 10 by the next survey cycle.
S — Specific: the team engagement score
M — Measurable: from 6.8 to 8.2 out of 10
A — Achievable: through targeted manager and feedback actions
R — Relevant: engagement predicts retention and output
T — Time-bound: by the next survey cycle
Engineering & Dev3 goals
Goal 16
SMART GoalRaise service uptime from 97.2% to 99.5% by the end of the quarter.
S — Specific: production service uptime
M — Measurable: from 97.2% to 99.5%
A — Achievable: through redundancy and incident fixes
R — Relevant: uptime is core to the product promise
T — Time-bound: by the end of the quarter
Goal 17
SMART GoalCut average deployment lead time from 5 days to 2 days by the end of the quarter.
S — Specific: average deployment lead time
M — Measurable: from 5 days to 2 days
A — Achievable: via CI/CD and pipeline improvements
R — Relevant: faster delivery ships value sooner
T — Time-bound: by the end of the quarter
Goal 18
SMART GoalLower the escaped-defect rate from 3.1% to under 1% by the end of Q2.
S — Specific: the escaped-defect (post-release) rate
M — Measurable: from 3.1% to under 1%
A — Achievable: through better test coverage and review
R — Relevant: fewer escaped defects means less rework
T — Time-bound: by the end of Q2
Customer Success3 goals
Goal 19
SMART GoalLift net revenue retention from 104% to 115% across your book by year-end.
S — Specific: net revenue retention across managed accounts
M — Measurable: from 104% to 115%
A — Achievable: through expansion plays and tighter renewals
R — Relevant: retention compounds faster than new logos
T — Time-bound: by year-end
Goal 20
SMART GoalCut gross logo churn from 9% to 5% by the end of the year.
S — Specific: gross logo churn rate
M — Measurable: from 9% to 5%
A — Achievable: with an at-risk playbook and earlier intervention
R — Relevant: churn is the biggest drag on net growth
T — Time-bound: by the end of the year
Goal 21
SMART GoalRaise the share of accounts with a completed onboarding plan from 55% to 90% this quarter.
S — Specific: accounts with a completed onboarding plan
M — Measurable: from 55% to 90%
A — Achievable: by making the plan part of handoff
R — Relevant: onboarded accounts retain far better
T — Time-bound: this quarter
Finance3 goals
Goal 22
SMART GoalShorten the monthly close from 10 business days to 5 by the end of Q3.
S — Specific: time to complete the monthly financial close
M — Measurable: from 10 business days to 5
A — Achievable: through reconciliation automation
R — Relevant: a faster close speeds every downstream decision
T — Time-bound: by the end of Q3
Goal 23
SMART GoalReduce days sales outstanding from 52 to 38 by the end of Q4.
S — Specific: days sales outstanding (DSO)
M — Measurable: from 52 days to 38 days
A — Achievable: via tighter invoicing and collections cadence
R — Relevant: DSO directly frees up working capital
T — Time-bound: by the end of Q4
Goal 24
SMART GoalBring forecast accuracy within 5% of actuals for three consecutive quarters.
S — Specific: variance between forecast and actual revenue
M — Measurable: within ±5% of actuals
A — Achievable: with a tighter pipeline-to-forecast model
R — Relevant: reliable forecasts underpin every plan
T — Time-bound: three consecutive quarters
Copy any goal above, swap in your own baseline and target, and give it a single owner before the period starts.
Turning a SMART Goal Into One That Moves
Writing the goal correctly is the first half. The other half is the habit that keeps it alive, because even a well-formed goal dies if nobody looks at it between planning and the deadline.
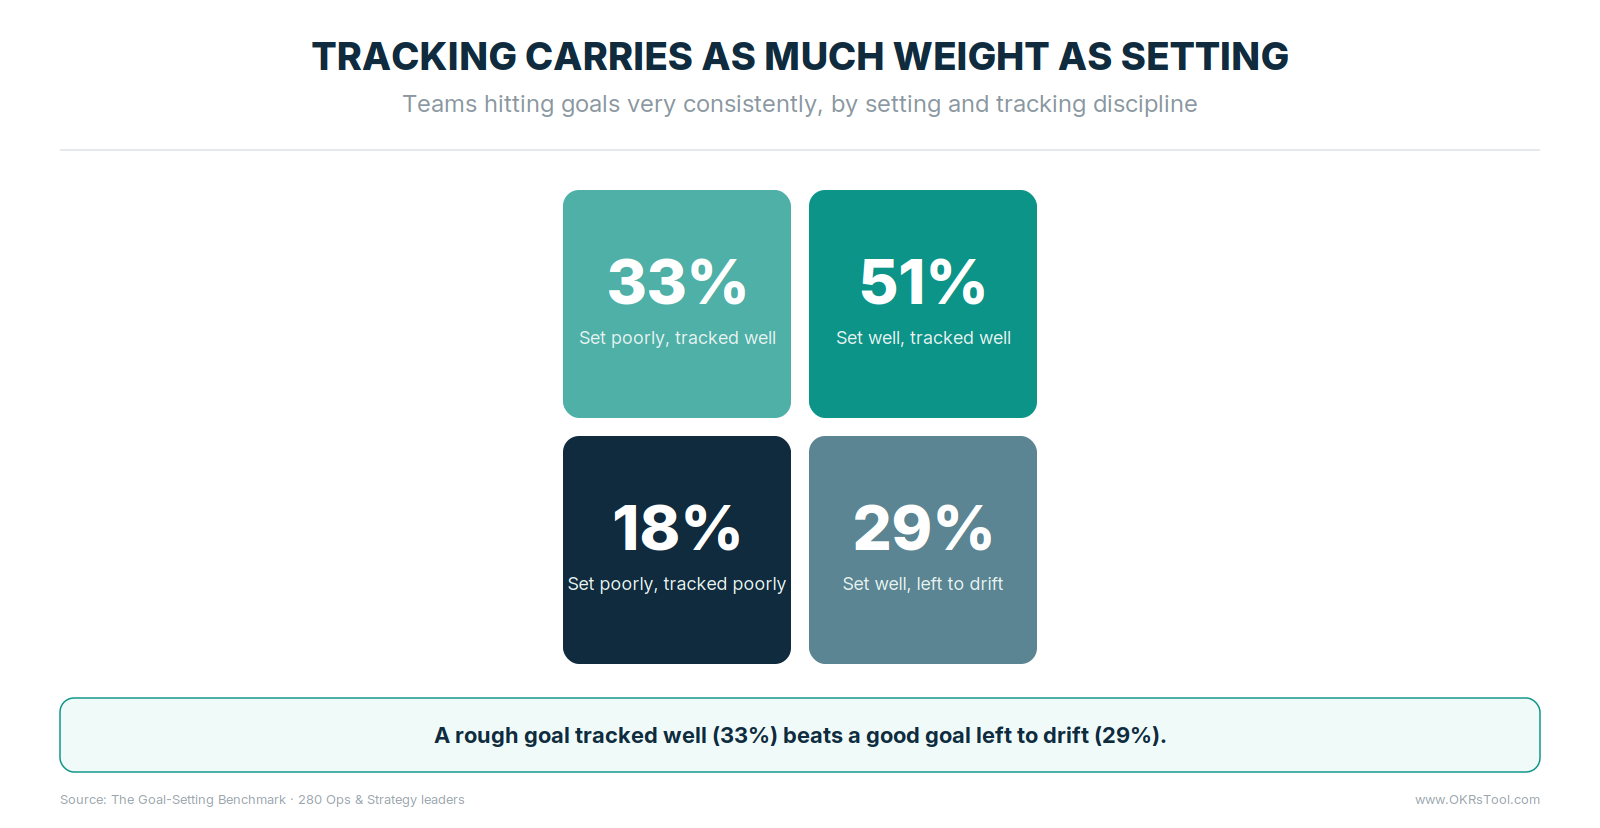
This is where the Goal-Setting Benchmark is blunt. It found that how a goal is tracked predicts success more reliably than how well it's written.
Split teams by both and the winning quadrant is the one that sets and tracks well, at 51% hitting goals very consistently — but a roughly written goal that's tracked closely (33%) still beats a well-written one left to drift (29%). A perfectly formed SMART goal nobody watches lands about where a sloppy one does.
Two habits do most of that tracking work. Teams that check each goal with a consistent weekly check-in complete 43% more of them, and teams that assign a single named owner to each one complete 26% more. Take three or four of the examples above, adapt the baselines to your own numbers, and put a name and a weekly check against each — that cadence is what turns a well-written sentence into a goal that actually moves.
Start With Three, Not Twenty Four
Whether a SMART goal gets hit or gets dropped comes down to one thing far more than ambition: whether it was written to be scored, and then actually tracked. Pick three or four that match where the work is right now, set honest baselines, give each an owner, and hold them to a weekly rhythm.
That combination — a scoreable goal plus the habit of watching it — is what the benchmark data rewards, whatever framework name sits on top. For the wider set these sit inside, SMART is one of several frameworks worth knowing.
Give every SMART goal a baseline, an owner, and a rhythm
OKRs Tool tracks the number, assigns the owner, and runs the weekly check-in — so a SMART goal stays SMART all quarter. Free for up to 5 users.
Steven is the founder of OKRs Tool, OKR software built for senior operators inside growing companies. Trusted by 350+ teams to run OKRs that survive beyond the first cycle — with weekly check-ins, required KR ownership and a visual alignment map that shows how every goal connects.