21 OKR Examples for Operations Leaders (2026)

21 OKR examples for operations teams, grouped by efficiency, cost, quality, capacity, systems, and vendors — each a measurable outcome.

Steven Macdonald
5 Mins read
July 30, 2026
21 OKR Examples for Operations Leaders (2026)

These 21 OKR examples for operations are built the way strong goals actually work: one clear objective, then measurable key results with a baseline, a target, and an owner. That last part matters more than it looks — across 20,952 real key results, 52% turned out to be tasks in disguise, with no measurable outcome attached. Every example here is grouped by the six areas most ops leaders own — efficiency, cost, quality, capacity, systems, and vendors — and written to avoid that trap.

Good OKR examples for operations are hard to find because operations is where strategy either becomes real or quietly stalls, which makes it one of the hardest functions to write clean goals for. The work is broad — process, cost, quality, team capacity, tooling, suppliers — and it's easy to end up with a list of activities ("roll out the new system," "review the vendor contracts") that keep everyone busy without proving anything moved.

The examples below avoid that trap. Every one is written as a measurable outcome, because that's the difference between a goal you can score and a task you merely complete. You'll find 21 ready-to-adapt OKR examples for operations teams, grouped across six sub-functions, each with an objective and three measurable key results.

Run these OKRs in a tool built for it

OKRs Tool gives every key result a baseline, a target, an owner, and a weekly check-in — so operations goals get tracked, not forgotten. Free for up to 5 users.

Try OKRs Tool Free →

What Makes a Strong Operations OKR

Before the examples, the shape they all share. An objective is qualitative and directional — where you're trying to take the function this quarter. Key results are measurable — how you'll prove you got there.

A good operations objective reads like a sentence a leader would actually say out loud: make fulfilment faster, get spend under control, make quality dependable. It carries no number of its own, because quantifying it is the key results' job. Each key result then names one metric with a starting point and a target, so anyone glancing at the goal can tell whether the quarter succeeded.
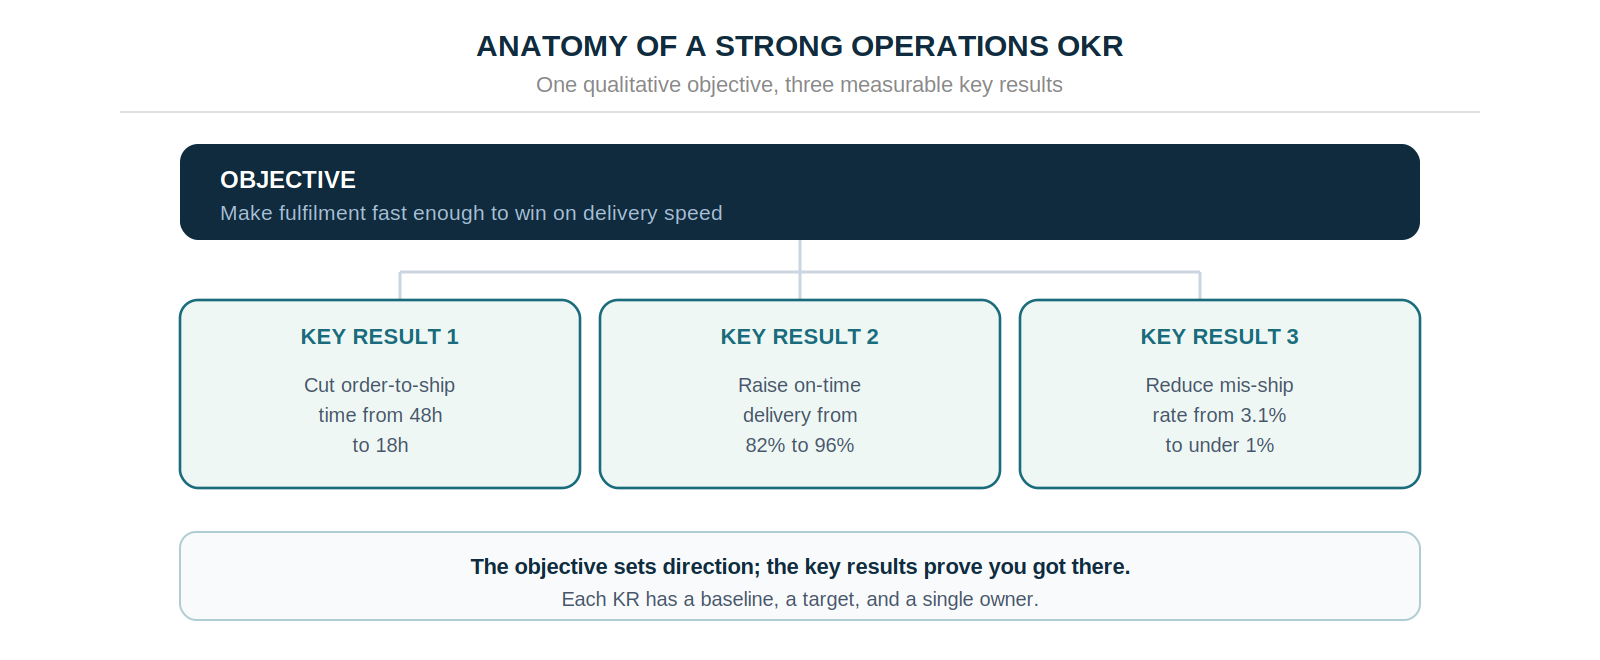
One objective — make fulfilment fast enough to win on delivery speed — with three key results cutting order-to-ship time, raising on-time delivery, and reducing the mis-ship rate

Three to five key results per objective tends to be the sweet spot: enough to cover the objective from more than one angle, few enough that the team stays focused rather than spread thin across a dozen half-tracked numbers.

The most common operations mistake is writing key results that are really tasks. "Implement the new WMS" is done the moment it's installed, whether or not anything improved. "Cut pick-error rate from 2.4% to under 1%" holds you to the result the system was supposed to deliver.

That distinction is the single biggest quality problem in real-world goals, and it is worth being strict about, since a task masquerading as a key result removes the accountability the goal was meant to create.

Why Operations Key Results Drift Into Tasks

Across 20,952 key results in the platform data, 52% turned out to be activities dressed up as outcomes. Operations is especially prone to it, because so much ops work genuinely is task-shaped — installing, rolling out, migrating. The fix is to keep asking what changes for the business once the task is done, and to make that the key result. Every example below follows the rule.

The tell is usually the verb. Key results built on doing-words — implement, launch, roll out, migrate, complete — describe an action the team takes, and an action is either done or not done, with nothing in between to track week to week. Outcome verbs — reduce, increase, cut, raise — describe a number moving, which is what a key result is supposed to capture.

When an ops goal reads "roll out the new WMS," the honest question is what that rollout is meant to change: faster picking, fewer errors, lower cost per order. Write the change as the key result and let the rollout live where it belongs, as the initiative underneath it.

21 OKR Examples for Operations, by Sub-Function

Grouped by the six areas most operations leaders own, from process efficiency to vendor management. Each objective has three measurable key results with a baseline and a target — adapt the numbers to your own starting points.

Process Efficiency 4 OKRs
OKR 1
ObjectiveSpeed up order fulfilment
  • Cut average order-to-ship time from 48h → 18h
  • Raise on-time delivery rate from 82% → 96%
  • Reduce mis-ship rate from 3.1% → under 1%
OKR 2
ObjectiveStreamline the core operational workflow
  • Reduce average process cycle time from 6.2 → 3.5 days
  • Cut handoffs per request from 9 → 5
  • Decrease rework rate from 18% → under 8%
OKR 3
ObjectiveEliminate manual bottlenecks
  • Reduce manual data-entry from 40 → 12 hours per week
  • Automate 6 of the 10 most-repeated manual tasks
  • Cut average request turnaround from 3 days → same-day
OKR 4
ObjectiveImprove throughput without adding headcount
  • Increase requests processed per person per week from 45 → 65
  • Reduce average queue wait time from 26h → 8h
  • Hold quality-error rate at or below 2% while volume rises 30%
Cost & Spend 3 OKRs
OKR 5
ObjectiveReduce operational cost per unit
  • Lower fully-loaded cost per order from $14.20 → $10.50
  • Cut expedited-shipping spend from 12% → under 4% of orders
  • Reduce overtime from 320 → under 120 hours per month
OKR 6
ObjectiveCut waste across the operation
  • Reduce inventory write-offs from $85K → under $30K per quarter
  • Lower idle-equipment time from 22% → under 10%
  • Decrease consumable waste per batch from 9% → 4%
OKR 7
ObjectiveTighten budget discipline
  • Reduce unplanned spend from 18% → under 6% of budget
  • Bring 90% of purchases onto approved-vendor contracts
  • Close monthly forecast-to-actual variance to within 3%
Quality & Reliability 4 OKRs
OKR 8
ObjectiveRaise process quality
  • Reduce defect rate from 4.5% → under 1.5%
  • Increase first-pass yield from 88% → 97%
  • Cut customer-reported quality issues from 45 → under 15 per month
OKR 9
ObjectiveImprove service reliability
  • Raise process uptime from 97.2% → 99.5%
  • Reduce mean time to resolution from 9h → 3h
  • Cut repeat incidents from 30% → under 10% of tickets
OKR 10
ObjectiveStrengthen compliance and audit readiness
  • Close 100% of open audit findings from the last cycle
  • Raise process-documentation coverage from 60% → 95%
  • Reduce audit-prep time from 3 weeks → under 1 week
OKR 11
ObjectiveReduce operational risk
  • Cut single-points-of-failure in critical processes from 12 → 3
  • Bring disaster-recovery test success rate from 70% → 100%
  • Reduce high-severity incidents from 8 → under 2 per quarter
Team Capacity & Enablement 4 OKRs
OKR 12
ObjectiveBuild cross-functional coverage
  • Increase processes with two or more trained operators from 40% → 90%
  • Reduce single-person-only tasks from 18 → 4
  • Complete cross-training for 100% of critical roles
OKR 13
ObjectiveImprove team capacity planning
  • Reduce forecast-to-actual staffing variance from 25% → under 8%
  • Cut last-minute shift changes from 30 → under 10 per month
  • Raise utilization rate from 68% → 85%
OKR 14
ObjectiveReduce operational team turnover
  • Lower voluntary turnover from 22% → under 12%
  • Raise team engagement score from 6.8 → 8.2 out of 10
  • Cut time-to-productivity for new hires from 8 → 4 weeks
OKR 15
ObjectiveImprove onboarding for operational roles
  • Reduce ramp to independent work from 6 → 3 weeks
  • Raise 90-day new-hire retention from 78% → 92%
  • Increase onboarding-checklist completion from 65% → 100%
Systems & Automation 3 OKRs
OKR 16
ObjectiveModernize the operations tech stack
  • Migrate 100% of tracking off spreadsheets into the ops system
  • Reduce tool-switching per task from 5 → 2 systems
  • Cut data-reconciliation time from 10h → under 2h per week
OKR 17
ObjectiveAutomate operational reporting
  • Automate 90% of recurring operational reports
  • Reduce report-prep time from 12h → under 2h per week
  • Cut reporting errors from 8 per month → zero
OKR 18
ObjectiveImprove data accuracy across systems
  • Raise data-accuracy rate across core systems from 91% → 99%
  • Reduce duplicate records from 14% → under 2%
  • Cut time spent correcting data errors from 15h → 3h per week
Vendor & Supply 3 OKRs
OKR 19
ObjectiveStrengthen vendor performance
  • Raise on-time vendor delivery from 84% → 96%
  • Reduce vendor-caused defects from 6% → under 2%
  • Bring 100% of key vendors onto quarterly scorecards
OKR 20
ObjectiveImprove supply-chain resilience
  • Add a qualified second source for 100% of single-sourced critical items
  • Reduce average lead time from 21 → 12 days
  • Cut stockout incidents from 15 → under 4 per quarter
OKR 21
ObjectiveOptimize procurement cost and speed
  • Reduce average procurement cycle from 14 → 6 days
  • Negotiate a 12% average cost reduction across the top 20 suppliers
  • Increase spend under contract from 55% → 85%

Making These OKRs Stick

A good objective is only the starting point. The examples above are outcome-shaped by design, but a well-written OKR still needs the habits underneath it to move.

Two habits do most of the work. Teams that track each objective with a consistent weekly check-in complete 43% more of their goals, and teams that assign a single named owner to each key result complete 26% more.

For operations especially — where goals span teams, shifts, and systems — a clear owner and a visible cadence are what keep an objective from becoming background noise by week six. Pick three or four of the examples above, adapt the baselines to your own numbers, and put a name and a check-in against each one.

Start With Three, Not Twenty-One

The temptation with a list like this is to adopt too much at once. Resist it. The strongest operations quarters come from three or four well-chosen objectives with real ownership behind each. A sprawling scorecard nobody can track does the opposite. Choose the examples that match where the operation actually hurts right now — the slowest process, the biggest cost leak, the flakiest system — set honest baselines, and commit to a weekly review cadence.

Do that, and these OKR examples for operations stop being items on a page and start being the goals that move your operation this quarter.

Turn these examples into goals your team tracks

Set baselines and targets, assign an owner to every key result, and run weekly check-ins — all in one place. Free for up to 5 users.

Try OKRs Tool Free →


Data: OKRs Tool platform data (876 organizations, 20,952 key results), The 2026 OKR Benchmark Report (200 organizations).


CEO Photo

Founder

Steven Macdonald│LinkedInX

Steven is the founder of OKRs Tool, OKR software built for senior operators inside growing companies. Trusted by 350+ teams to run OKRs that survive beyond the first cycle — with weekly check-ins, required KR ownership and a visual alignment map that shows how every goal connects.