The most common OKR failure isn't a bad Objective — it's a Key Result that measures activity instead of change. Our analysis of 7,857 real Key Results found that 52% were tasks or KPIs in disguise. This guide covers how to choose metrics that actually move the needle, with examples across every function.
Writing a solid Objective is hard enough. Choosing the right metrics to track it is where most teams get stuck.
Too vague, and OKRs become aspirational statements nobody acts on. Too narrow, and they become a task list with a fancier name. The right OKR metrics don't just measure performance — they guide weekly decision-making, force prioritization, and make progress visible before the cycle ends.
What Are OKR Metrics?
In OKRs, metrics live in the Key Results. The Objective defines the direction — the Key Results define the evidence that you're moving.
Objective: Improve customer onboarding experienceKey Result: Increase Day 7 activation from 45% to 65%
The metric isn't the work — it's the signal. It tells you, week by week, whether the team's effort is translating into actual results. If the metric can't be measured, it's not a Key Result. If the team can't affect it, it's not a useful one.
Our analysis of 7,857 real Key Results found that 52% were tasks or KPIs in disguise — measuring what was done rather than what changed. The most common pattern: verbs like "Launch," "Complete," and "Conduct" appearing where "Increase," "Reduce," and "Improve" should be. That distinction is the entire metric selection problem in a single sentence.
The 5 Traits of a Strong OKR Metric
1. Outcome-based, not activity-based
Great OKRs measure what changes, not what gets done. "Launch a new onboarding flow" is an activity. "Increase activation rate from 40% to 60%" is an outcome. Focusing on outcomes forces teams to connect effort to impact — and makes OKR scoring meaningful at cycle end rather than a celebration of output.
The diagnostic question: What are we trying to cause by doing this? That's the real metric.
2. Specific and time-bound
"Improve user experience" is too vague to guide weekly decision-making. "Increase onboarding completion rate from 55% to 75% by end of Q3" creates a clear finish line and lets teams check their pace throughout the OKR cycle.
3. Measurable and visible
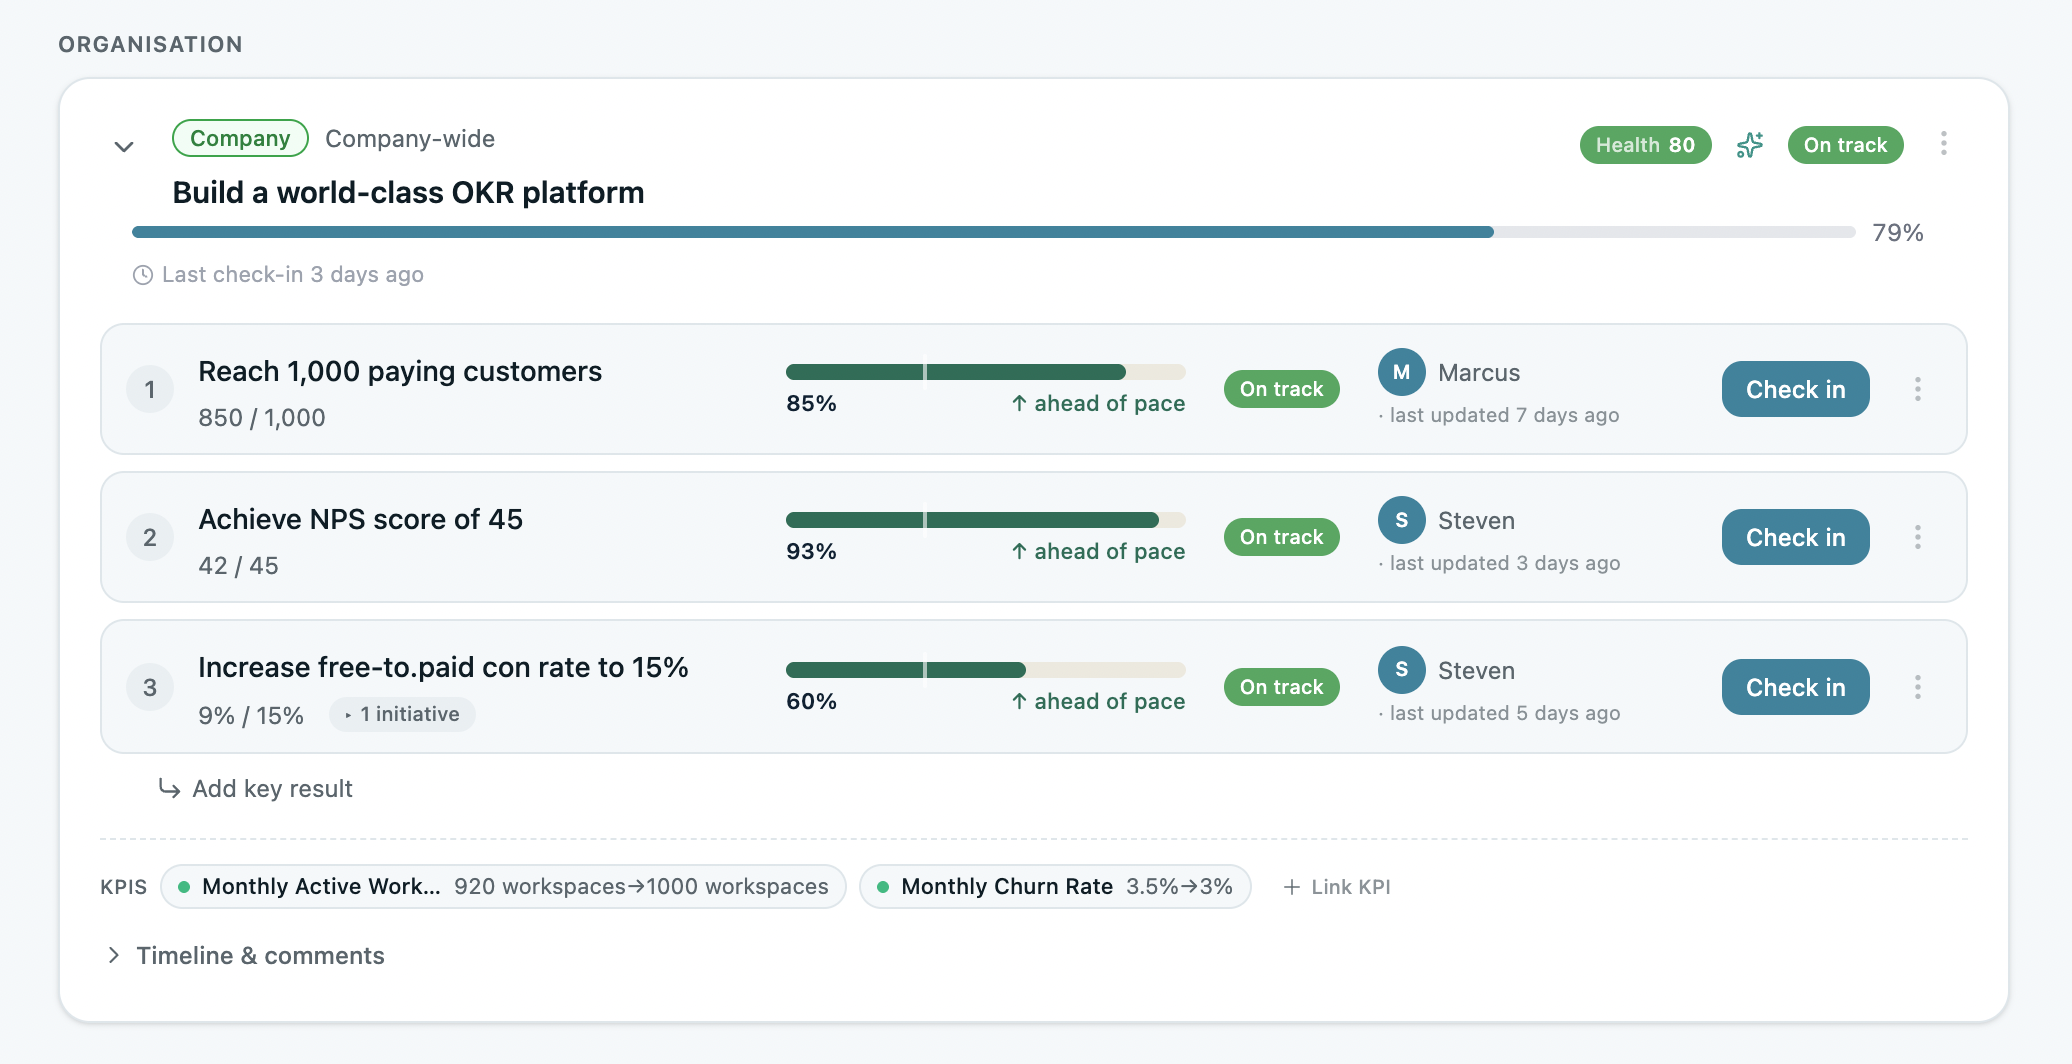
If the team can't pull a stat, graph, or simple number to represent the Key Result weekly, the metric isn't trackable — and probably isn't useful. The best OKR dashboards surface Key Result progress automatically, so teams aren't chasing numbers to report.
4. Influenced by the team writing it
Key Results need ownership — and ownership only works if the team can actually move the metric. "Increase total company revenue" looks impressive in a product team's OKR, but if that team doesn't own the sales motion, it's a setup for frustration. A better option: "Increase product-qualified leads from X to Y."
The test: Can this team move this number with the resources and authority they have this quarter?
5. Not a vanity metric
Pageviews, follower counts, and app downloads can feel like progress without indicating that anything meaningful changed. Choose metrics that reflect behavior change, satisfaction, or business impact. "Reach 50% activation on Feature X" is better than "Announce Feature X launch" — the first tells you something changed, the second tells you something happened.
Types of OKR Metrics
Not all OKRs use the same kind of metric. Here are five categories to frame the selection:
The right category depends on the Objective. Most teams benefit from a mix — tracking growth and engagement together, or efficiency and satisfaction side by side — rather than defaulting to whichever metric is easiest to pull.
How to Track OKR Metrics Without Manual Overhead
The most common tracking failure isn't choosing the wrong metric — it's letting the update process become a burden that teams avoid.
Strong tracking has three structural requirements: a single named owner per Key Result who is responsible for the weekly update, an automated nudge that triggers the update without requiring anyone to schedule it, and a dashboard that shows status without a meeting to interpret it.
Teams with a consistent weekly check-in habit complete 43% more OKRs than those reviewing monthly or ad hoc. The check-in isn't just a progress report — it's the mechanism that surfaces whether the metric is being driven by the right activities, and flags stalled Key Results before they become missed goals.
For teams evaluating spreadsheets: the free OKR template for Excel covers basic tracking. The limitation is structural — no automated nudges, no at-risk flagging, no alignment visibility.
What to Do When a Metric Stalls
A stalled metric isn't failure — it's a signal. It tells you what's unclear, what's missing, or what needs to shift. The OKR Intelligence Report 2026 found 7% of off-track Key Results are simply abandoned mid-cycle — informally dropped with no revision or escalation. The mid-cycle response to a stalled metric determines whether a goal recovers or becomes another invisible OKR.
Check the initiatives first. It's surprisingly common to set a goal and then realize no one has owned the execution. A metric without active initiatives is a wish. If a Key Result is below 50% at the week-six mid-cycle review, the first question is: what are the 2–4 bets tied to this metric, and are they high-leverage enough to move it?

Reevaluate the metric itself. Some metrics stall because they weren't well-formed. The target may have been unrealistic, the metric may not respond on a short time horizon, or it may be a lagging indicator when a leading one would surface problems earlier. Adjusting a Key Result mid-cycle is a sign of good judgment, not a sign of failure.
Name the real blocker. If the initiative is sound and the metric is reasonable, the bottleneck is usually operational — someone spread too thin, a cross-team dependency, or a priority shift mid-cycle. Stalled progress is often an operations problem disguised as a strategy issue. The earlier the real blocker is named, the faster it can be fixed.
Pivot or persist — explicitly. There's no shame in replacing a weak initiative or reframing a Key Result based on what the data shows. OKR scoring at cycle end is more useful when teams made explicit decisions about what changed and why — rather than arriving at a 0.0 score without a documented reason.
Final Thoughts
OKRs are only as strong as the metrics they're built on. Clear Objectives align people. Clear metrics get them moving in the same direction — and give them a way to know if they're winning.
The test for any Key Result metric is three questions: is it measurable, is it meaningful, and can this team move it? A metric that passes all three will drive a better cycle than five metrics that don't.
For teams writing Key Results for the first time, the Key Results examples guide shows what outcome-based metrics look like across every function. For teams looking at the full OKR structure: OKR structure →
Data: OKRs Tool platform data (7,857 Key Results analyzed), OKR Intelligence Report 2026 (222 organizations).