75% of organizations now link OKR outcomes to reviews. 30+ evaluation examples across every function, built on the behavior-plus-outcome formula.
Steven Macdonald
7 Mins read
July 12, 2026
Across 222 organizations, 75% have now formally linked OKR outcomes to performance decisions. A review that describes how someone shows up — collaborative, proactive, reliable — without referencing what they delivered is half a review. The 30+ examples below connect behavior to outcome, in the same conversation, across every function.
Most performance review calibration follows the same pattern: managers arrive with impressions, leave with ratings, and produce feedback describing how someone operates without any reference to what they delivered this quarter. "Demonstrates strong communication skills" is a behavioral rating. It can't be acted on, because it doesn't say what the person did or what changed as a result.
The OKR Intelligence Report 2026 shows how far the standard has shifted: 75% of organizations have formally linked OKR outcomes to performance decisions — 47% as one factor among several, 28% with OKR scores directly influencing ratings. Behavioral assessment alone is no longer the norm. The organizations generating the best outcomes connect what someone delivered — their OKR results — to how they operated, in the same review.
Free Performance Review Template
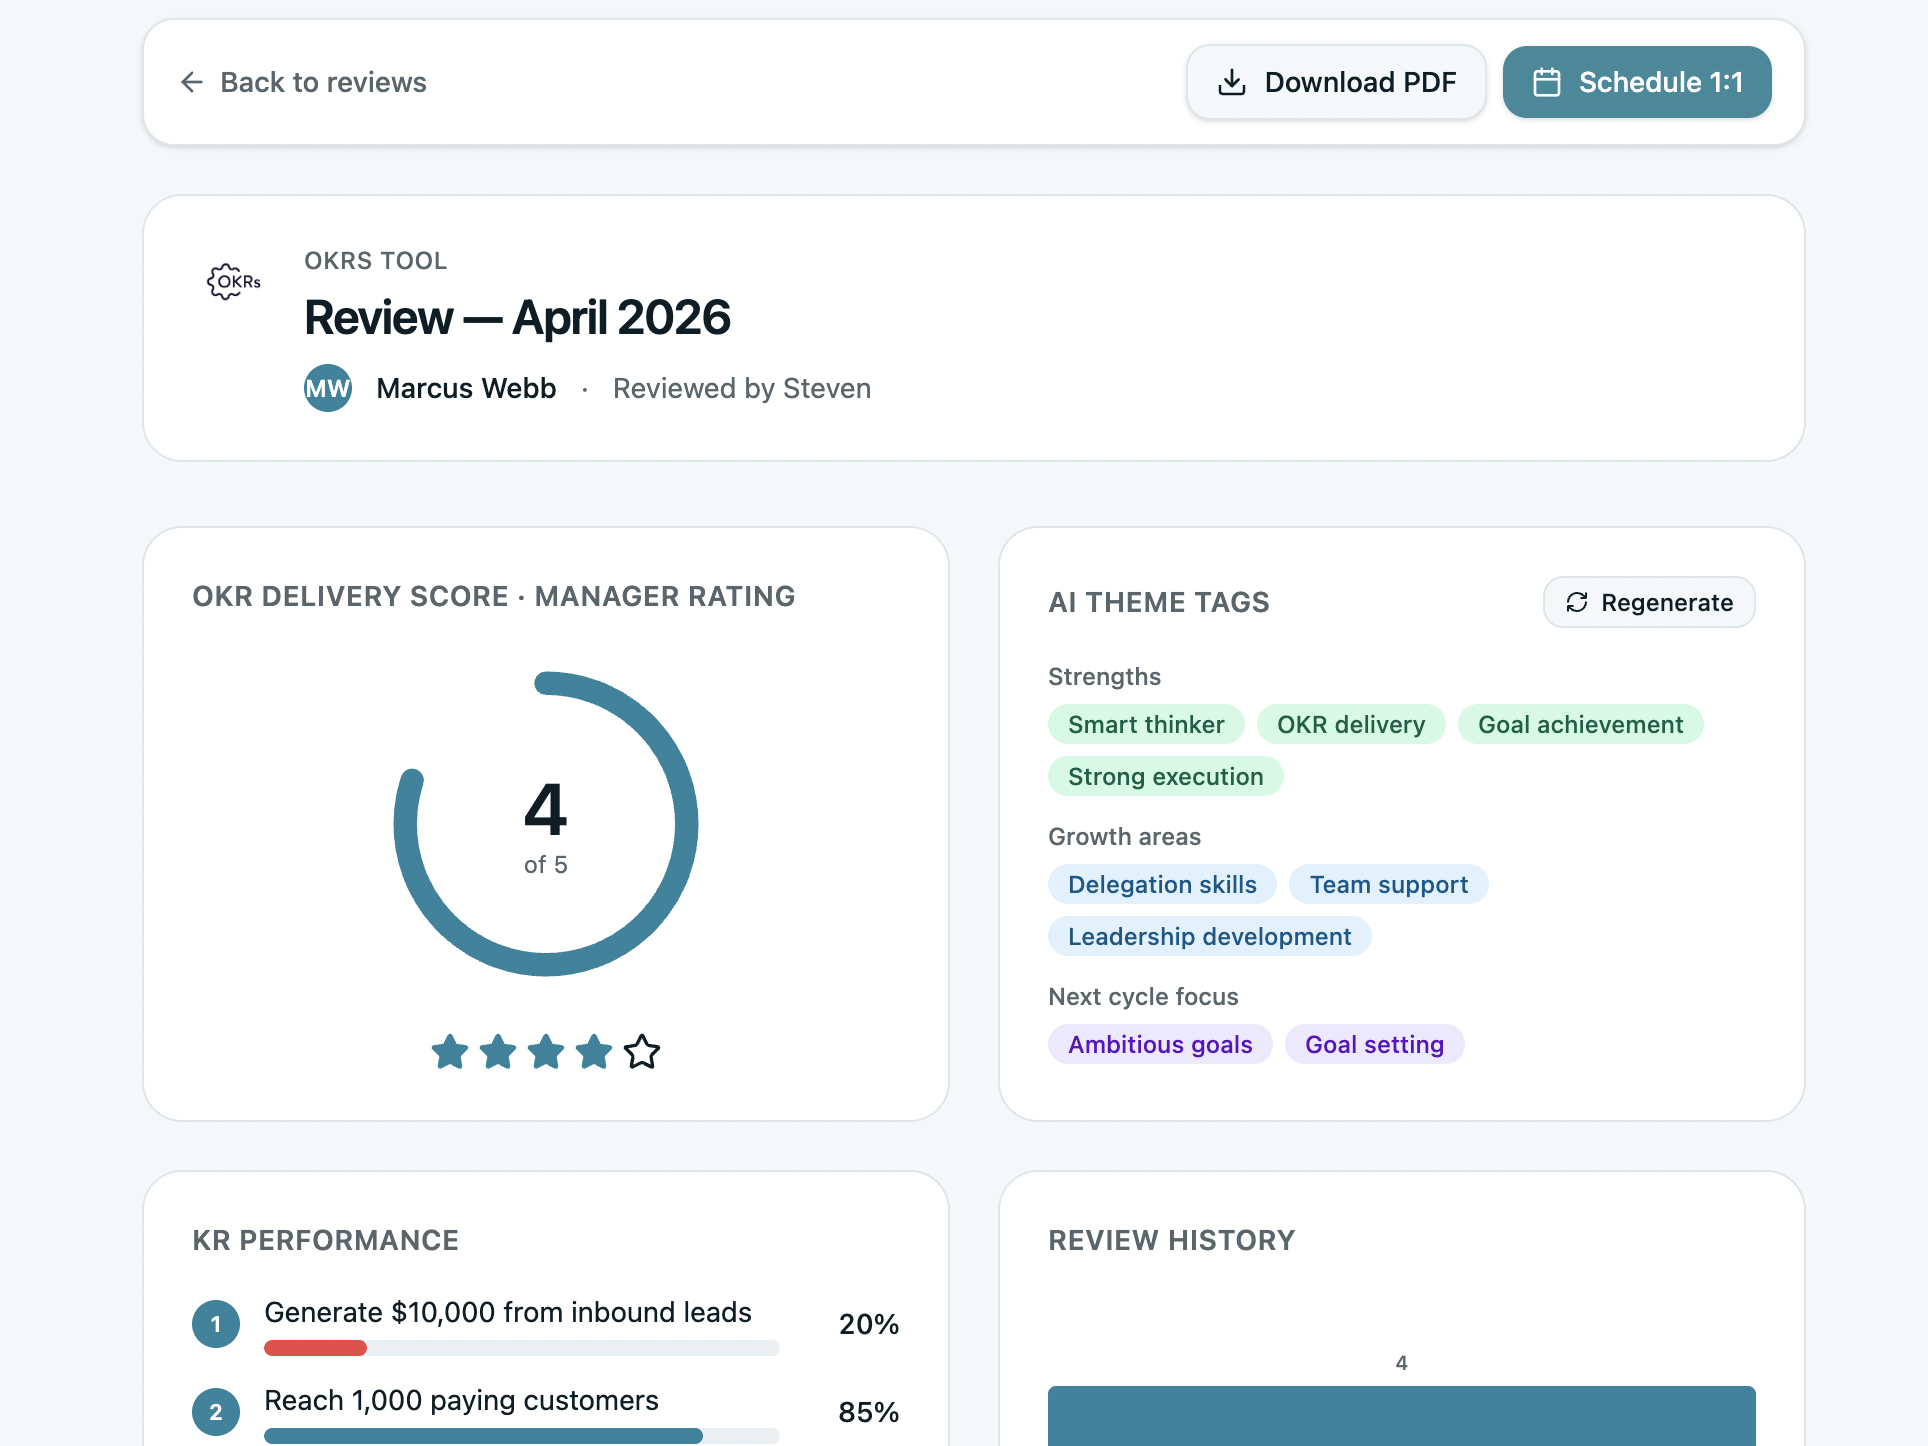
OKR delivery score, 360 competency ratings, strengths, growth areas, and next-cycle focus — one structured review form.
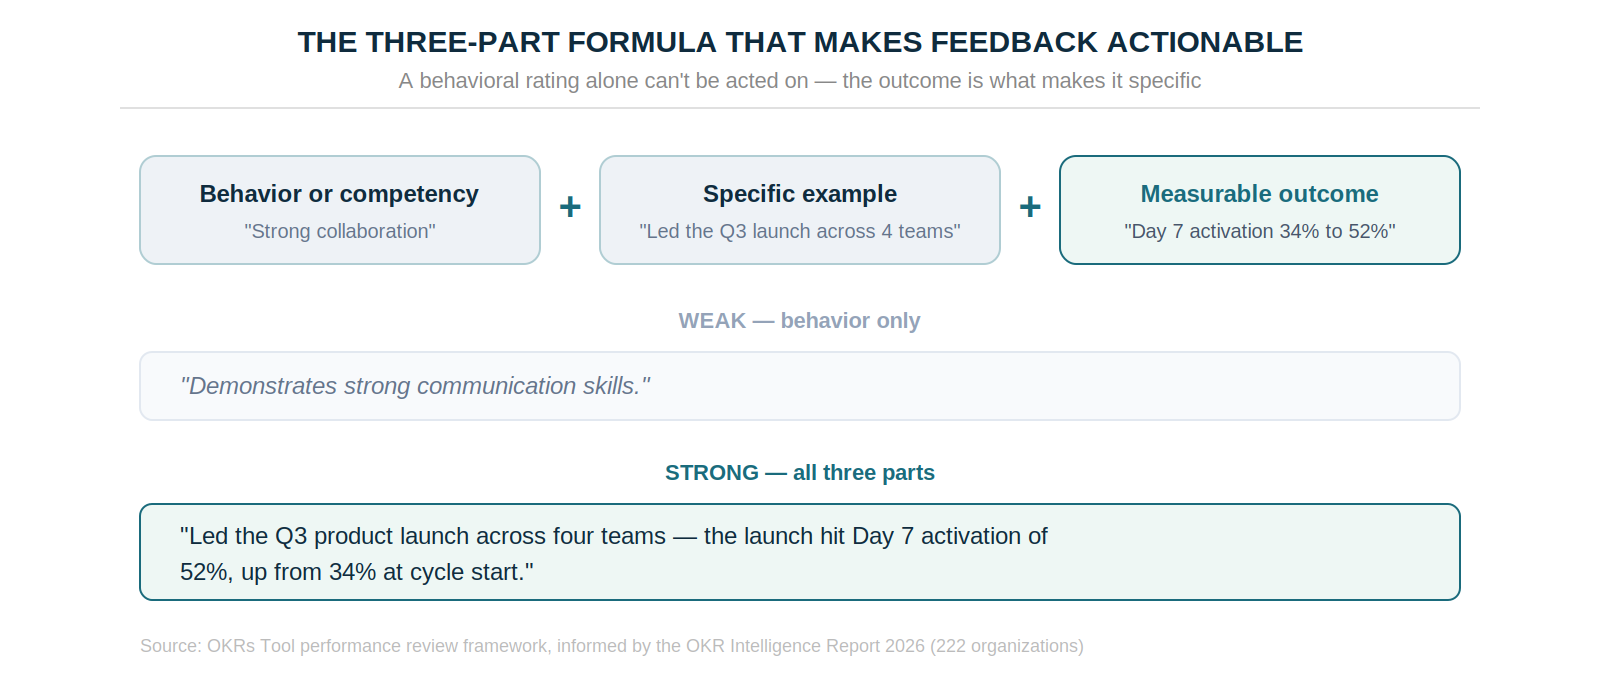
The problem with most performance evaluation examples is that they describe behaviors without connecting them to outcomes. "Demonstrates strong communication skills" is a behavioral rating. "Delivered the enterprise onboarding module two weeks ahead of schedule, cutting onboarding support tickets by 40%" is an outcome-connected evaluation — and only the second is specific enough to act on.
The formula is consistent: a behavior or competency, a specific example, and a measurable outcome or OKR impact. Applied, it reads: "Demonstrated strong cross-functional collaboration by leading the Q3 product launch across four teams — the launch hit Day 7 activation of 52%, up from 34% at cycle start." The second half is what turns an impression into feedback the person can build from.
The OKR Delivery Score: The Missing Layer
The OKR scoring layer is what makes the behavior-to-outcome connection structural rather than conversational. A score of 0.7–0.8 against an ambitious Key Result is strong performance — the 70–80% range that marks genuine stretch. A 0.3 against a modest target is a different conversation entirely. The number gives the review a factual foundation that behavioral observation alone can't.
The scoring method also predicts the consequence culture. Organizations using traffic-light or RAG status treat missed goals as retrospective learning more often; organizations using percentage completion trigger formal accountability conversations more often. Neither is wrong — but being explicit about the scoring approach before the cycle begins is what makes evaluations feel fair rather than arbitrary.
A performance dashboard that surfaces these scores automatically, alongside 360 feedback from peers and manager, is what removes the manual compilation that otherwise keeps OKR data out of the review entirely.
30+ Performance Evaluation Examples by Category
The examples below are grouped by rating tier — Exceeds, Meets, and Needs Improvement — with a final set organized by competency. Every one follows the same formula: it names the behavior, cites a specific example, and attaches the measurable outcome or OKR delivery result. Read them as language patterns to adapt, not scripts to copy.
Exceeds Expectations
For team members who consistently delivered above target — hitting ambitious OKRs at 0.8+ or demonstrably expanding scope.
Sales
Exceeded enterprise pipeline target for Q3 — MQL-to-SQL conversion reached 38% against a target of 32%, generating three new enterprise accounts ahead of cycle end. Consistently shared pipeline intelligence with marketing, directly contributing to a 40% increase in enterprise content MQLs.
Product
Led the onboarding redesign from brief to launch in 6 weeks — Day 7 activation moved from 34% to 56%, exceeding the Key Result target of 52%. Proactively identified the session timeout issue in week four and resolved it before it became a support escalation.
Engineering
Delivered zero P1 incidents across the full cycle, against a target of reducing incidents from 8 to 2 per month. Took ownership of the incident retrospective process and introduced the runbook format now used across all three engineering teams.
Marketing
Grew organic MQLs from 90 to 210 per month — exceeding the cycle target of 180. Identified the enterprise intent gap in the existing content library and proposed the content cluster strategy now being adopted for Q4.
Customer Success
Improved 90-day retention from 68% to 84% against a target of 80% — the strongest retention result this team has delivered in three cycles. Completed QBRs with all 15 enterprise accounts before deadline, with 100% participation.
People / HR
Reduced time-to-hire from 45 days to 24 days against a target of 28. Introduced the structured interview scorecard now used across all hiring panels, reducing calibration time from 3 sessions to 1.
Meets Expectations
For team members who delivered on their quarterly OKR commitments and operated effectively within their function.
Sales
Delivered enterprise pipeline contribution in line with Q3 targets — MQL-to-SQL conversion reached 30% against a target of 32%. Strong discovery call quality, with demo-to-proposal rate improving from 45% to 62% across the cycle.
Product
Shipped the onboarding module on schedule — Day 7 activation improved from 34% to 48% against a target of 52%. The gap was driven by a third-party API delay identified in week nine; escalation and resolution were handled effectively.
Engineering
Reduced P1 incidents from 8 to 3 per month — slightly below the target of 2, but with a meaningful structural improvement: the monitoring dashboard introduced in week six means incidents are now detected in under 15 minutes rather than 45.
Marketing
Grew organic MQLs from 90 to 165 per month — slightly below the 180 target. Content quality improved significantly across the cycle, with average time-on-page up 35% and bounce rate down 18%.
Customer Success
Maintained 90-day retention at 78% against a target of 80%. Completed 12 of 15 QBRs before cycle end — the three outstanding accounts were rescheduled due to customer-side availability, not follow-through issues.
People / HR
Reduced time-to-hire from 45 days to 31 days — close to the target of 28. The process improvement was consistent; the remaining gap reflects two specialist roles with unusually long notice periods.
Needs Improvement
For team members where delivery fell short and a specific development plan is warranted. The language stays factual, specific, and forward-looking — not evaluative.
Sales
Enterprise pipeline contribution came in at 18% MQL-to-SQL conversion — below the 32% target and below the prior cycle's 22%. Three discovery calls were not followed up within the agreed 48-hour window. Q4 action plan agreed: daily pipeline review, co-call with the Sales Manager for the first four enterprise accounts.
Product
The onboarding module shipped 3 weeks late — Day 7 activation came in at 38% against a target of 52%. The delay was partially scope changes, but two escalation points were not raised until week ten when intervention was no longer possible. For Q4, a weekly scope check-in has been added to the sprint cadence.
Engineering
P1 incidents remained at 6 per month against a target of 2. Root cause analysis on three of the six identified the same monitoring gap — a fix was proposed in week two but not implemented until week eleven. For Q4, the incident response SLA has been formalized and added to the team OKRs.
Marketing
Organic MQLs grew from 90 to 95 per month — significantly below the 180 target. Three of four planned content pieces were published late, and one was not published at all. For Q4, content deadlines will be tracked as Key Results with weekly check-in visibility.
Customer Success
90-day retention fell from 68% to 61% against a target of 80%. Two enterprise accounts churned, both of which had flagged dissatisfaction in week three; the escalation protocol was not followed. For Q4, any account scoring below 7 on the weekly CSAT pulse requires a CS lead review within 48 hours.
People / HR
Time-to-hire increased from 45 days to 52 days against a target of 28. Three roles were open for more than 90 days due to delayed job brief approval and two sourcing restarts. For Q4, job brief sign-off has been moved to week one of cycle planning.
Competency-Based
For evaluations using a 360 feedback competency framework alongside OKR delivery — paired as a strength and a development area.
Execution & Delivery — Strong
Delivered three of four Key Results at or above target. The one miss — enterprise pipeline conversion — was identified at the mid-cycle review, escalated appropriately, and a recovery plan was in place by week seven. OKR Delivery Score: 4/5
Execution & Delivery — Development area
Two of four Key Results came in below 40% — both flagged at-risk in week eight, but no escalation or revision was made. A goal that exists on the dashboard with no active owner driving it. For Q4, a standing rule: any KR below 50% at week six triggers a formal mid-cycle review.
Communication — Strong
Consistently kept cross-functional stakeholders informed without being asked. The enterprise onboarding redesign involved four teams — all four leads cited clear communication and proactive updates as a key reason the project landed on time.
Collaboration & Teamwork — Development area
Strong individual delivery, but three peer reviewers noted that handoffs consistently required rework. The pattern is scope — taking on more than can be completed cleanly before passing over. For Q4, an explicit handoff checklist has been agreed for all cross-functional deliverables.
Problem Solving — Strong
Identified the infrastructure bottleneck in week four — before it appeared in any monitoring dashboard — and proposed a fix that prevented a P1 incident. Peer score: 4.8/5
Growth Mindset — Development area
Two reviewers noted that process-improvement suggestions were often met with defensiveness rather than curiosity. Reflected in the retrospective data — the same initiative format ran for three consecutive cycles without a structured review. For Q4, the retrospective now includes a specific "what would we do differently" section.
The through-line across all four categories is the same: even the "Needs Improvement" examples stay factual and forward-looking rather than evaluative. Each pairs the shortfall with its cause and a specific commitment for the next cycle — the same logic a cycle retrospective applies to goals — which is what separates a development plan from a reprimand.
What to Avoid
The weakest evaluation language shares one trait: no example, no outcome, nothing the person can act on. Each row below pairs a common phrase with why it fails and a stronger, outcome-connected rewrite.
Weak language
Why it fails
Stronger version
"Is a great team player"
No example, no outcome — unmeasurable and unactionable
"Led the cross-functional launch team for Q3, coordinating four teams to deliver on time — all four leads cited their coordination as a key success factor"
"Needs to work on communication"
No specificity — the person doesn't know what to change
"Three of four peer reviewers noted that project updates came reactively, after problems arose. For Q4, a standing weekly update to the CS lead has been agreed"
"Exceeded expectations this quarter"
No data — which expectations, exceeded by how much?
"Delivered four of four Key Results above target — OKR Delivery Score 5/5. Enterprise pipeline conversion reached 38% against a target of 32%"
"Shows potential"
Vague — potential for what, demonstrated how?
"Proposed the incident monitoring framework adopted by all three engineering teams — reducing P1 detection time from 45 minutes to under 15"
"Missed some targets this quarter"
No specificity, no cause, no forward plan
"Two of four Key Results came in below 40%. Root cause was scope management. For Q4, a standing WIP limit of three active initiatives has been agreed"
How to Structure a Performance Evaluation
The OKR cycle and the review cycle should align, and the most effective structure runs in five layers. It starts with the OKR delivery score — each Key Result scored 0.0–1.0 and rolled into an overall figure, the factual foundation of the review.
Then competency ratings, five to seven competencies scored from 360 feedback across self, manager, and peers, each supported by a specific example.
Third, theme synthesis — identifying consistent patterns across competency scores and check-in data into strengths, growth areas, and next-cycle focus. Surfacing these from the full dataset avoids the recency bias that affects manual synthesis.
Fourth, development commitments — one specific, measurable commitment per growth area. Not "improve communication" but "send a weekly project update to the CS lead every Monday by 10am."
Fifth, review history — trend data across cycles. A single review is a snapshot; three cycles reveal whether performance is improving, stable, or declining. The review template built into OKRs Tool structures all five into one connected view, pulling OKR data automatically and connecting it to the 360 scores.
The Connection Between OKRs and Evaluations
The goal-setting process predicts the consequence culture. Organizations using collaborative goal-setting treat missed goals as learning events 48% of the time; organizations using top-down goal-setting trigger formal accountability conversations 45% of the time. How goals are set determines whether the evaluation that follows improves performance or simply records it.
There's a structural gap most organizations miss. Only 15% bring new hires into OKR ownership within their first week — meaning 85% are running evaluations for people who have been disconnected from the organization's primary measurement framework for weeks or months after joining. Connecting onboarding to OKR ownership makes the evaluation that follows far more specific, and far more fair.
The organizations generating the highest returns from performance management connect OKR delivery data to competency assessment in the same review — not as an afterthought, but as the foundation. The formula behind every example above, behavior plus example plus measurable outcome, is what produces language both parties can point to, build from, and use to make the next quarter better than the last. See how OKRs Tool runs 360 reviews alongside the OKR cycle — free for up to 5 users.
Performance reviews connected to OKR delivery
OKRs Tool runs 360 reviews alongside OKR cycles — KR completion rates, competency scores, theme synthesis, and review history in one dashboard. Free for up to 5 users.
Steven is the founder of OKRs Tool, OKR software built for senior operators inside growing companies. Trusted by 350+ teams to run OKRs that survive beyond the first cycle — with weekly check-ins, required KR ownership and a visual alignment map that shows how every goal connects.