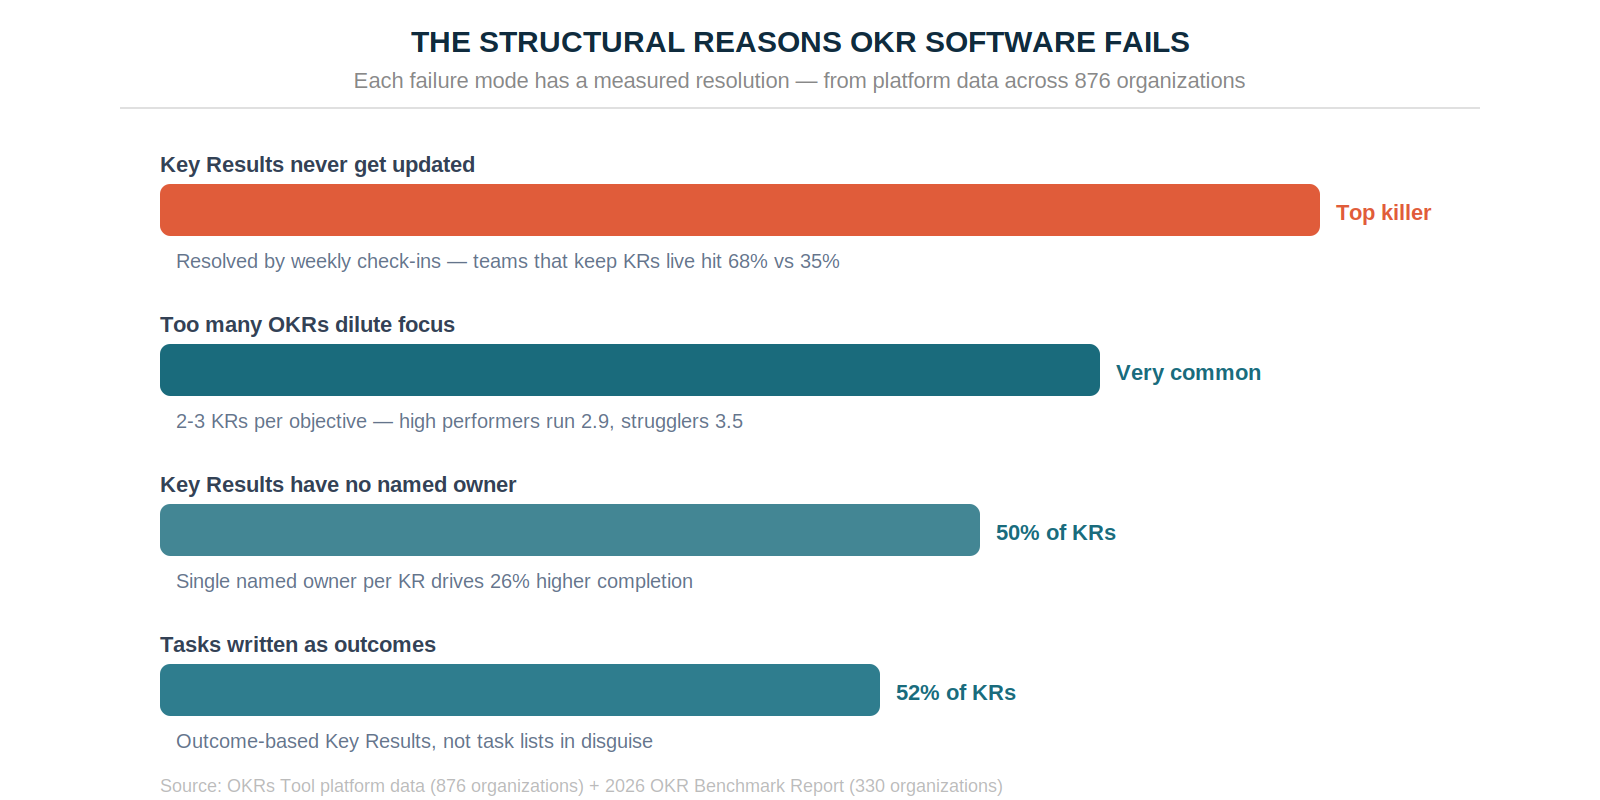
Across 876 organizations, the single strongest predictor of OKR success was whether Key Results ever got updated during the cycle. Teams that kept them live hit their goals at 68%; teams that let them go dark hit 35%. That gap — not the framework — is why most OKR software fails, and it's the first of nine recurring failure modes the platform data measures.
Adopting OKR software is rarely smooth. Objectives come out vague, Key Results get written as tasks, teams disengage by cycle two, and the whole system quietly becomes a document nobody opens. None of these are framework problems — they are execution problems, and each one has a measured fix.
The nine challenges below are drawn from the patterns that show up most consistently across real OKR programs. Each is paired with what the 2026 OKR Benchmark Report and OKRs Tool's platform data show actually resolves it — not generic advice, but the specific behavior that separates teams that succeed from teams that abandon the framework.
1. Key Results Get Written Once and Never Updated
This is the single biggest reason OKR software fails, and it's the one most teams underestimate. Across the platform data, whether Key Results ever moved during the cycle was the strongest predictor of success in the entire dataset. Teams that kept their Key Results updated hit their goals at 68%. Teams whose Key Results went dark hit them at 35%.
What resolves this is structural, not motivational: an automated weekly check-in that forces the number to move. Teams running weekly check-ins complete 43% more OKRs than those reviewing monthly or ad hoc. Software that sends the nudge and surfaces the number beats any amount of good intention.
2. Objectives Are Vague from the Start
When Objectives come out fuzzy, the Key Results underneath them have nothing to anchor to, and the whole cycle drifts. This shows up most in a team's first two or three cycles, before the muscle for writing sharp Objectives has developed.
Starting with two or three Objectives tied directly to the most critical priorities of the quarter — not a comprehensive list of everything the team is doing. An Objective should be qualitative, memorable, and something the team genuinely believes in. The maturity curve in the benchmark data confirms this improves with practice: completion climbs from 51% in cycles 1–2 to 79% by cycle five as Objective-writing sharpens.

3. Too Many Key Results Dilute Focus
Overloading an Objective with Key Results is one of the most common and most measurable mistakes. High-performing organizations in the platform data ran a median of 2.9 Key Results per Objective. Struggling organizations ran 3.5. More Key Results per goal correlated consistently with worse outcomes.

The mechanism is attention. Every Key Result a team is actively tracking competes with every other for the same weekly focus. Three well-owned Key Results outperform four where attention is spread thin. Keep it to two or three per Objective, each measuring a genuinely different dimension of the change.
4. Key Results Have No Named Owner
Roughly 50% of all Key Results in the platform data had no named owner at all — and Key Results with a single named owner were completed at materially higher rates than those with shared or absent ownership. A goal owned by everyone is owned by no one.
The 2026 OKR Benchmark Report puts a number on it: required single ownership drives 26% higher completion. A hard rule solves it — every Key Result gets exactly one named owner before the cycle starts, and the software should refuse to let a Key Result go live without one.
5. Key Results Are Tasks in Disguise
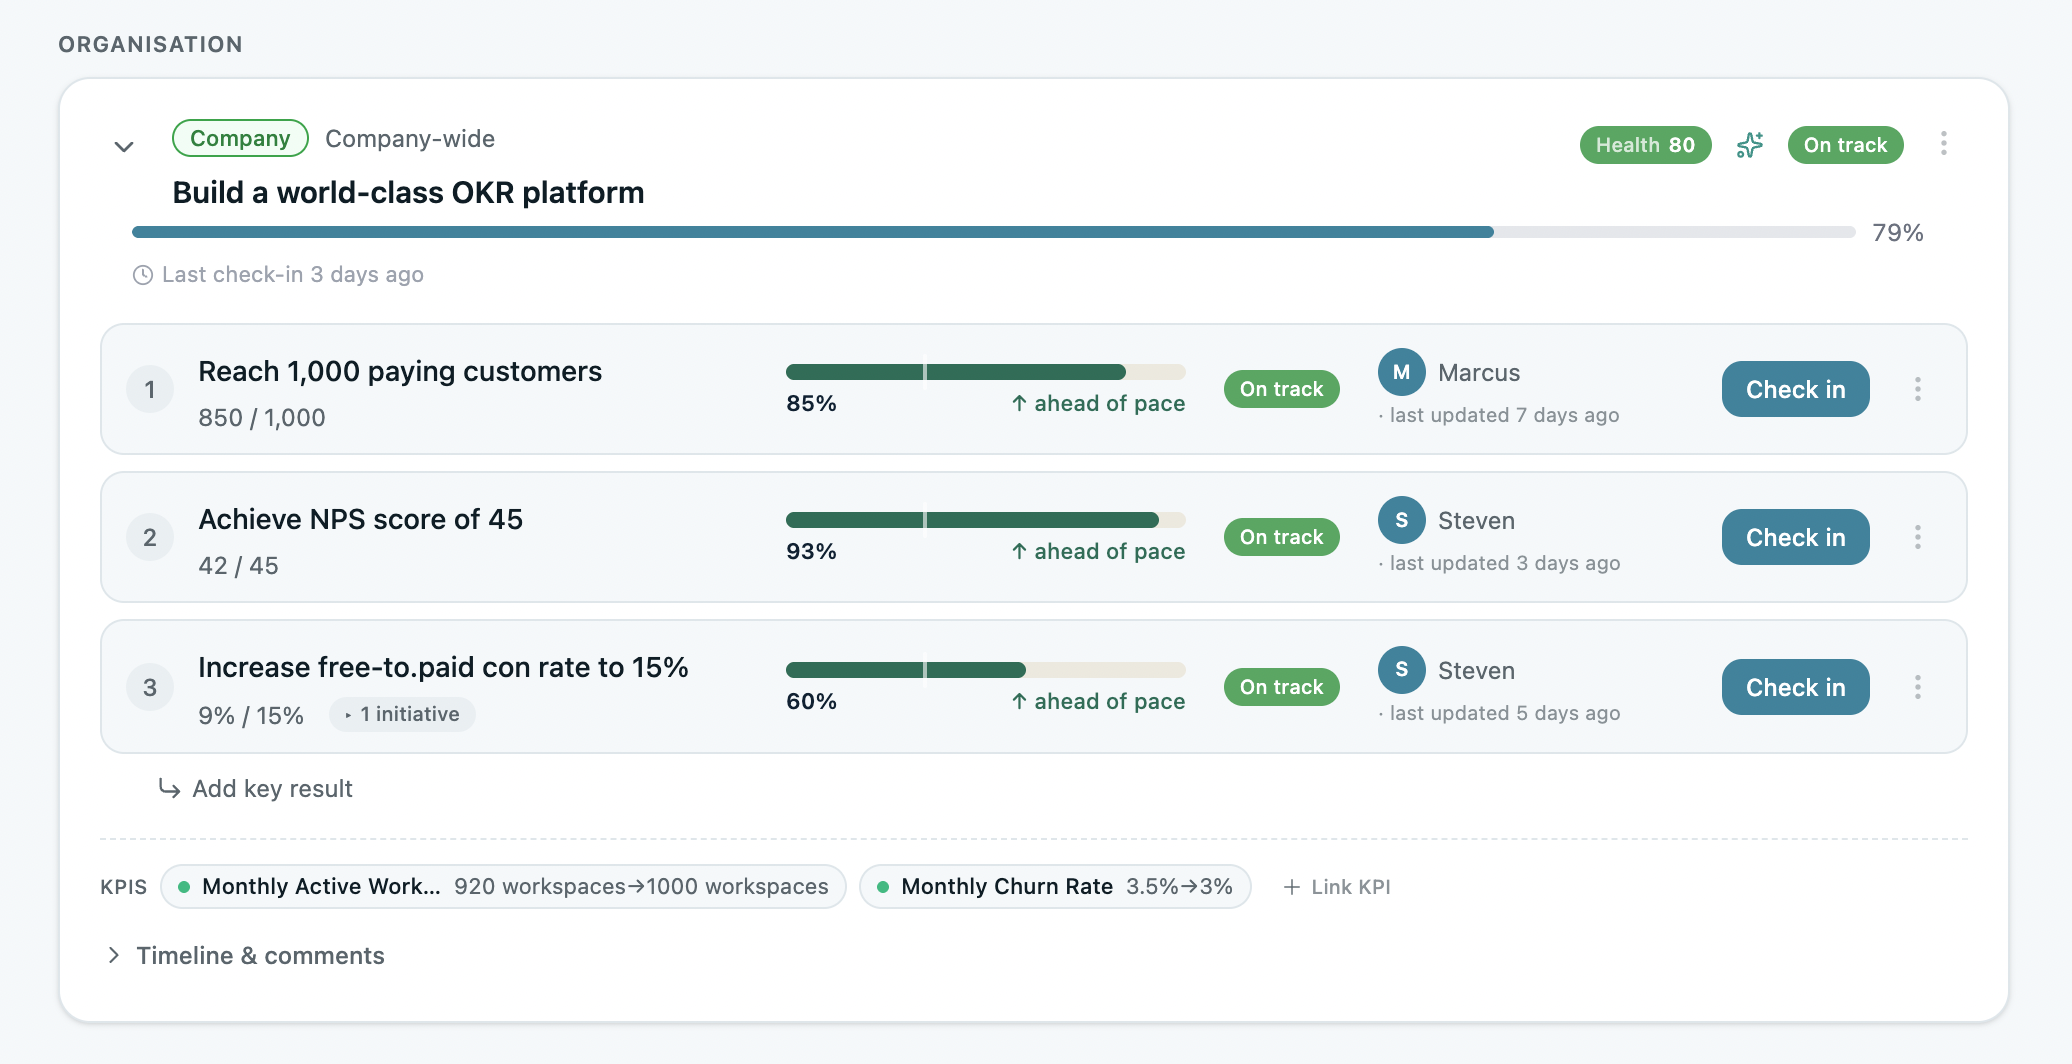
The most common structural flaw in OKR writing is the task masquerading as a Key Result. OKRs Tool's analysis found 52% of Key Results across growing teams were tasks or existing metrics dressed up as outcomes. "Launch the onboarding sequence" is a task. "Increase onboarding completion from 45% to 75%" is a Key Result.
The distinction matters because a task can be completed without moving anything that matters. Writing every Key Result as a measurable outcome moved from a baseline toward a target closes the gap — and to catch task-shaped Key Results in the planning session before the cycle starts, not at the end when it's too late.
6. Teams Work in Silos and Goals Don't Connect
When departments set goals independently, cross-functional alignment breaks down — and the benchmark data shows 65% of teams admit their goals aren't clearly linked to company strategy. Different priorities pull in different directions, and nobody notices until the quarterly review.
Visibility resolves it. When every team's Key Results sit in a single alignment view connected to company Objectives, teams self-align and spot dependencies early. This is where OKR software earns its place over spreadsheets — the cascade from company Objective to team Key Result is visible rather than assumed.
7. Nobody Buys In and Engagement Erodes
OKR software only works when the team is engaged, and engagement is the most common thing teams blame when they quit: 35% of teams that abandoned OKRs cited low engagement, not the framework or the goals. The erosion is gradual — enthusiasm lasts two weeks, then the file gathers dust.
Buy-in comes from involvement. Teams that help set their own goals — proposing Key Results in response to company Objectives rather than receiving them top-down — internalize the targets in a way that assigned goals never achieve. A consistent weekly habit then keeps that engagement alive through the middle of the quarter, when energy typically dips.
8. Output Gets Measured Instead of Outcomes
Tracking activity instead of impact is a subtle failure that feels productive. A team can ship features, run campaigns, and complete tasks while the metrics that matter stay flat. Measuring "number of emails sent" tells you the team was busy; measuring "conversion rate" tells you whether the work mattered.
Writing Key Results around outcomes — customer acquisition, retention, conversion, revenue — rather than the inputs that supposedly drive them is what changes this. When check-ins reinforce the question "what changed as a result of our work?" rather than "what did we do?", goal quality improves cycle over cycle.
9. OKRs Are Treated as a One-Time Exercise
The teams that get the most from OKRs treat each cycle as a learning loop. The platform data is direct on this: high-performing organizations had run a median of 20 OKR cycles versus 7 for strugglers. The return on OKRs is not front-loaded — it compounds as each cycle's retrospective sharpens the next.
A genuine retrospective at the end of every cycle changes the trajectory: what moved, what stalled, what to change next quarter. Teams that run consistent retrospectives complete 30–45% more goals the following quarter.

The Common Thread Across All Nine
Eight of these nine challenges point to the same underlying fix: OKRs that are actively owned and updated week over week produce dramatically better outcomes than OKRs that are set and left. The framework isn't the variable — the execution habits are. Named ownership, two to three outcome-based Key Results per Objective, and an automated weekly check-in resolve the majority of the failure modes above at once.
The right software makes those habits structural rather than dependent on discipline. See how OKRs Tool is built to prevent these nine failure modes by default — named ownership enforced, weekly nudges automated, and at-risk Key Results surfaced before the miss. Free for up to 5 users.
Data: OKRs Tool platform data (876 organizations, 7,419 objectives, 20,952 key results), The 2026 OKR Benchmark Report (330 organizations).