Across 330 organizations, teams running 1–2 OKRs per quarter reached high completion 58% of the time. At 3 OKRs that drops to 38%. At 4 or more it falls to 27%, and 8% abandon the cycle entirely. Yet 35% of teams still set three or more. The relationship between goal count and achievement is not linear — it's inverse.
The instinct to set more OKRs is understandable. Every function has priorities, every quarter has multiple things worth pursuing, and a short list can feel like an admission that some work doesn't matter. But the benchmark data is unambiguous: adding a third or fourth OKR doesn't increase what a team achieves. It reduces it.
The mechanism is attention, not capacity. A Key Result that gets reviewed in a weekly check-in, discussed when it stalls, and actively pushed by a named owner competes with every other Key Result for the same finite weekly focus. Doubling the number of goals doesn't double the attention available to move them.
The Completion Curve Runs Backwards
The 2026 OKR Benchmark Report measured completion against the number of OKRs each team carried into the quarter. The pattern held across 330 organizations and every team size in the dataset.
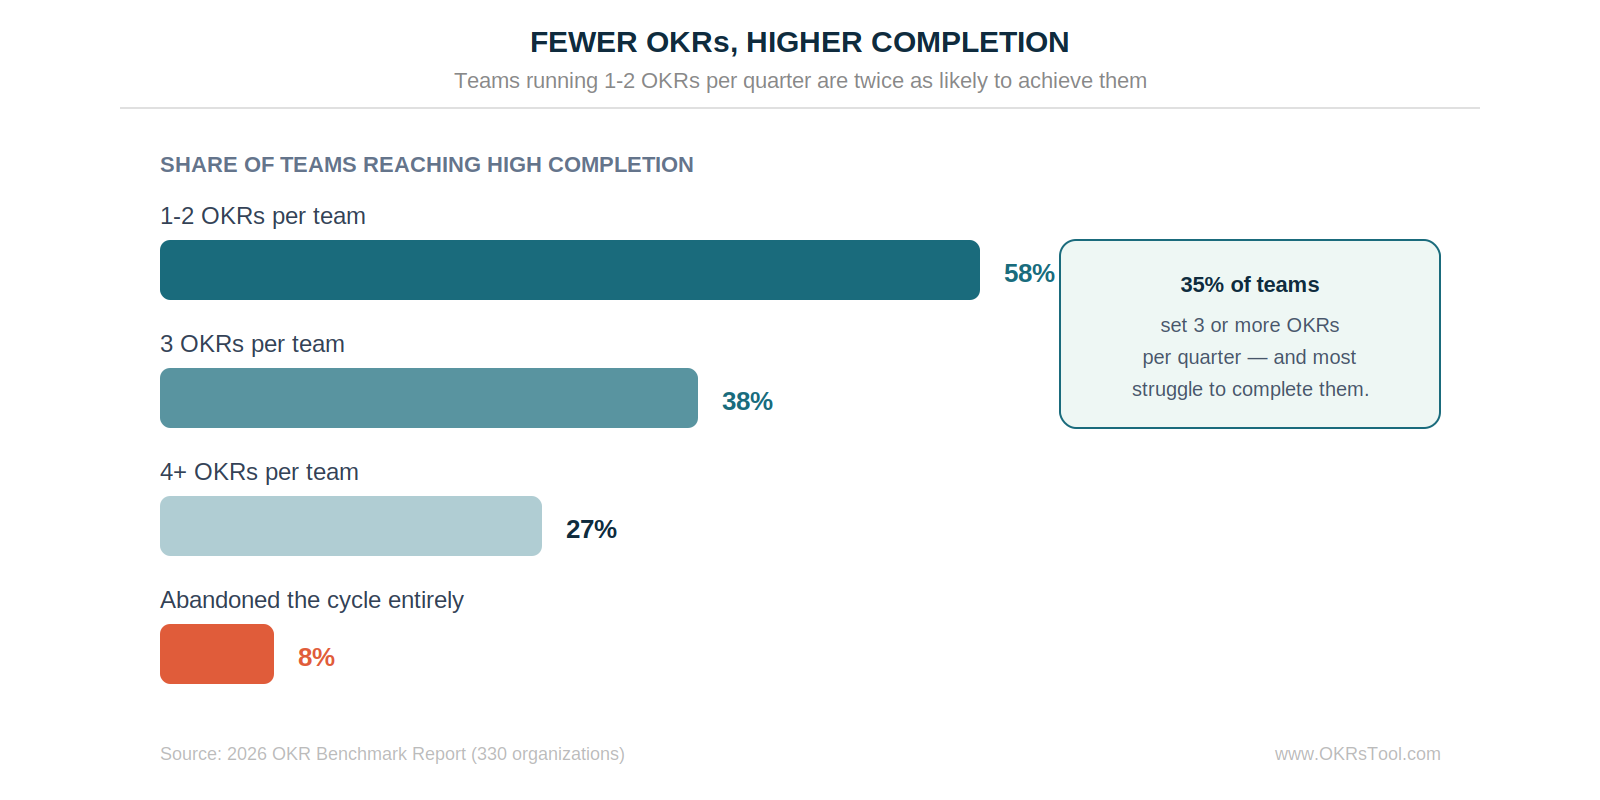
Teams carrying one or two OKRs reached high completion 58% of the time. At three, that fell to 38%. At four or more it dropped to 27% — less than half the rate of the focused teams — and 8% of organizations abandoned the cycle entirely rather than face a board of goals they could never finish.
Despite this, 35% of teams still set three or more OKRs per quarter. The gap between what the data shows and what teams actually do is the most expensive planning error in the OKR framework, and it happens at the moment the quarter is being planned, before a single check-in has taken place.
Two OKRs Per Team, Per Quarter
The number the data supports for a team is one to two Objectives per quarterly cycle. Not three as a compromise, and not four with the intention of dropping two later. Two is the ceiling for a team that intends to finish what it starts.
At the company level, two to three Objectives is the practical range. These set the strategic direction that team-level goals ladder up to — revenue growth, customer retention, a product bet — and they should be few enough that every person in the organization can name them. Only 30% of employees can name all their company's top goals unprompted, and that number falls further as the list grows.
Individual OKRs are optional and frequently counterproductive. They add cascade depth and administrative weight without adding the thing that actually predicts success: whether a Key Result has a named owner and gets updated weekly. Most organizations of 50 to 200 people are better served by stopping the cascade at the team level.
Two to Three Key Results Per Objective
The same inverse relationship appears one level down. Across 876 organizations, high-performing teams ran a median of 2.9 Key Results per Objective. Struggling teams ran 3.5. More Key Results per goal correlated consistently with worse outcomes.

Two to three Key Results per Objective is the range the platform data supports. Below two, the Objective becomes vague — a single measure rarely captures whether a qualitative goal was genuinely achieved. Above three, attention dilutes and the weekly check-in becomes a status recital rather than a decision-making conversation.
Each Key Result should measure a genuinely different dimension of the change the Objective describes. Three metrics that all move together aren't three Key Results; they're one Key Result measured three ways.
Churn measures whether customers leave. NPS measures whether they'd recommend. Onboarding completion measures whether they got value early. Each moves for a different reason, and together they describe retention from three angles.
Why Teams Overload the Board Anyway
The overload rarely comes from ambition. It comes from an unwillingness to say, during OKR planning, that some work doesn't rise to the level of a quarterly goal. Every function has a project it cares about, and adding it to the OKR board feels like validation. Removing it feels like a demotion.
But an OKR is not a to-do list, and putting a project on the board doesn't make it important — it makes the important things harder to see. The benchmark statistics are direct about what happens next: struggling teams left 31% of their objectives frozen at zero progress for the entire cycle. High performers left 4%. A board of goals nobody moved is worse than a shorter board, because it teaches the team that goals are decorative.
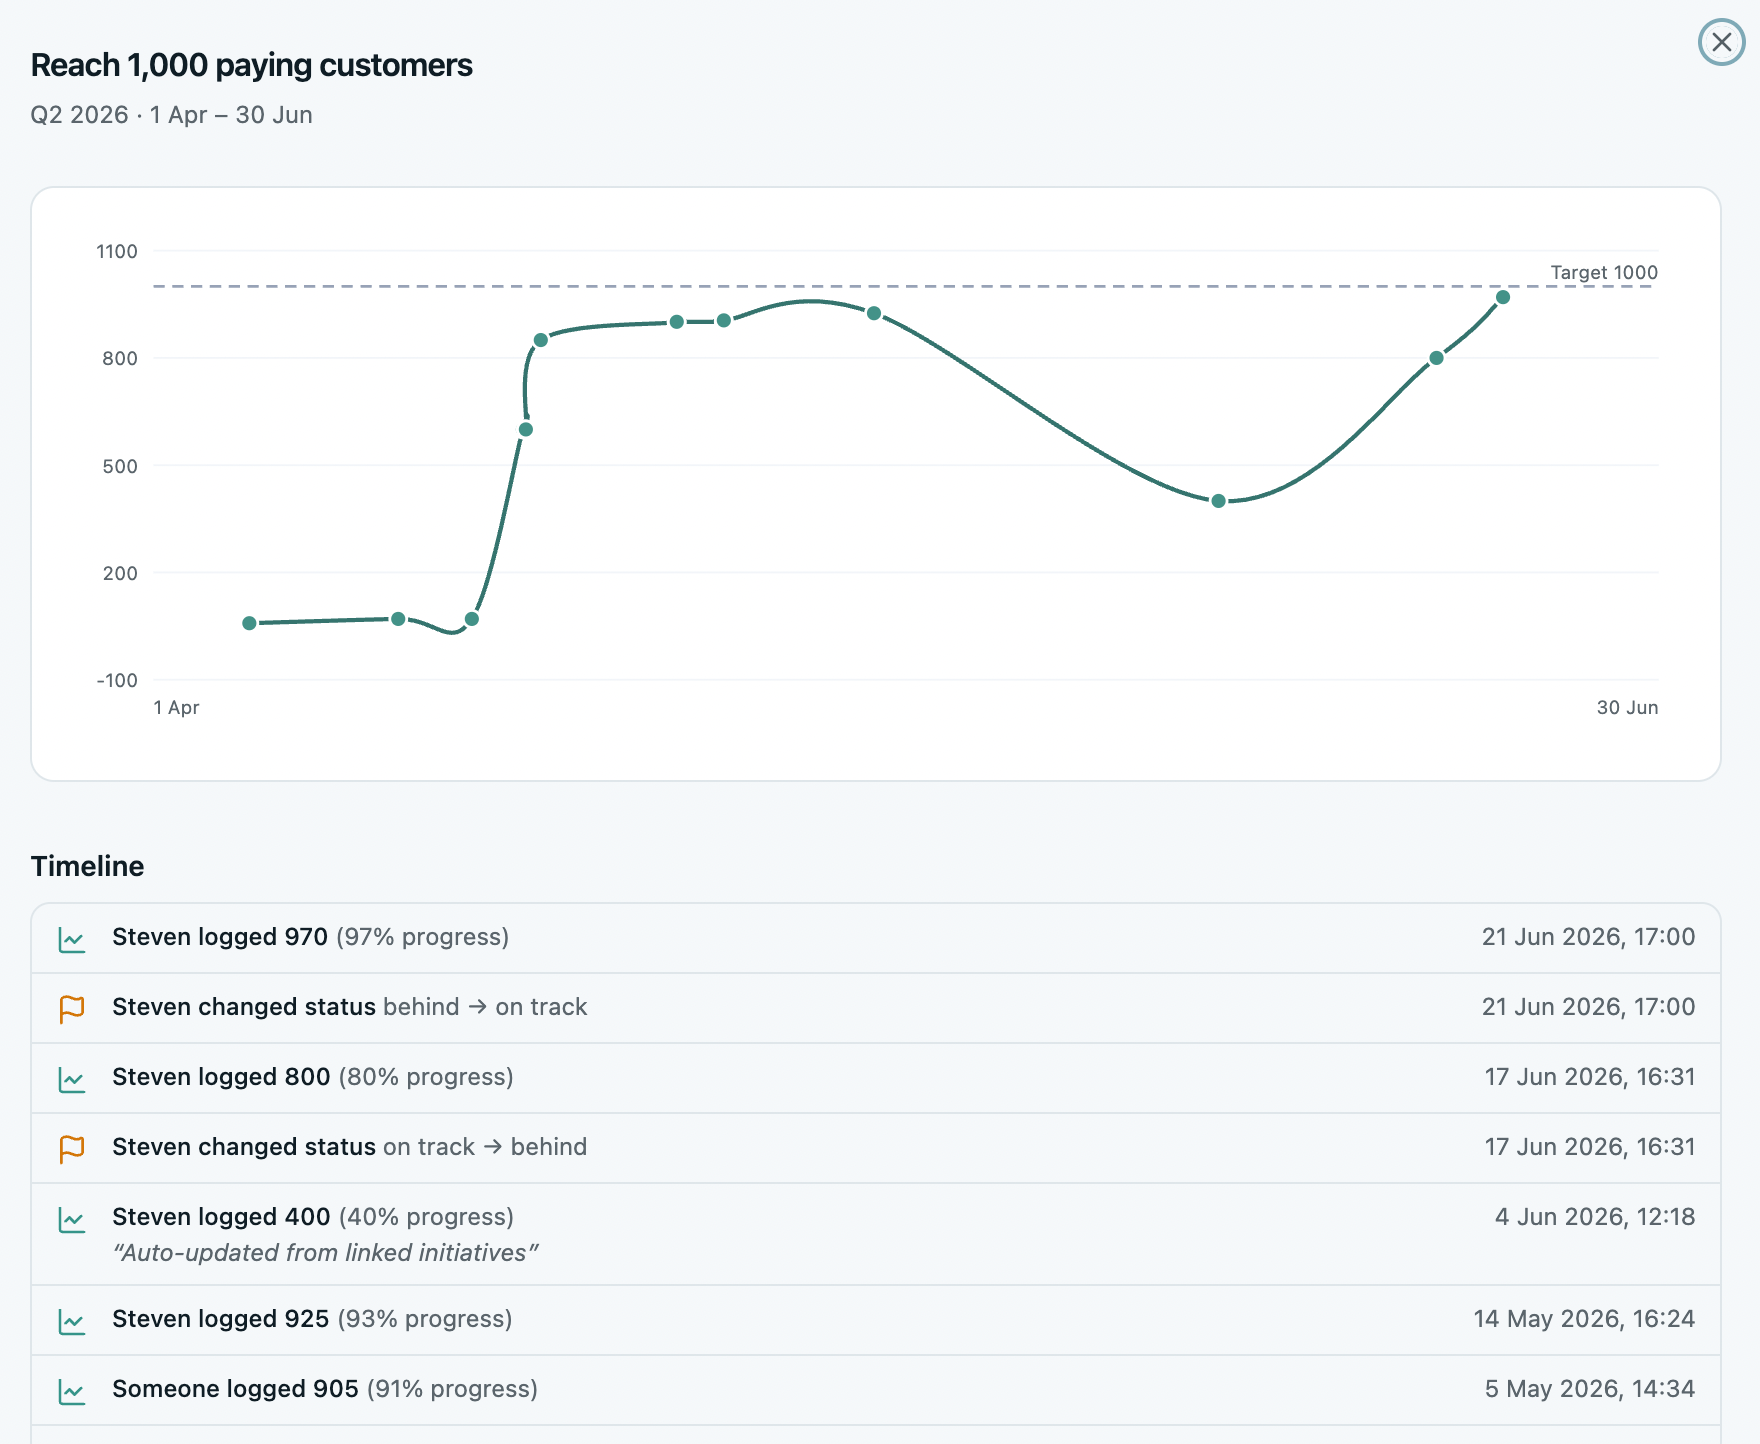
The weekly check-in habit is where this becomes visible. With two OKRs, a 20-minute check-in can genuinely interrogate what moved and why. With five, the same 20 minutes becomes a round-robin of status updates and nothing gets decided.
Fewer Goals, Finished
The right number of OKRs is the number a team can genuinely pursue every week for a full quarter — which the benchmark data places at one to two per team, two to three at company level, and two to three Key Results beneath each Objective. Teams in their first OKR cycle should start below those numbers, not at them.
Cutting the board is the hardest planning decision and the one with the clearest evidence behind it. A team that runs two OKRs and completes both has achieved more than a team that ran five and completed none. See how OKRs Tool keeps a lean set of goals visible, owned, and moving — free for up to 5 users.
Data: The 2026 OKR Benchmark Report (330 organizations), OKRs Tool platform data (876 organizations, 7,419 objectives, 20,952 key results), The State of Goal Management (210 full-time employees at growing companies, 2026).