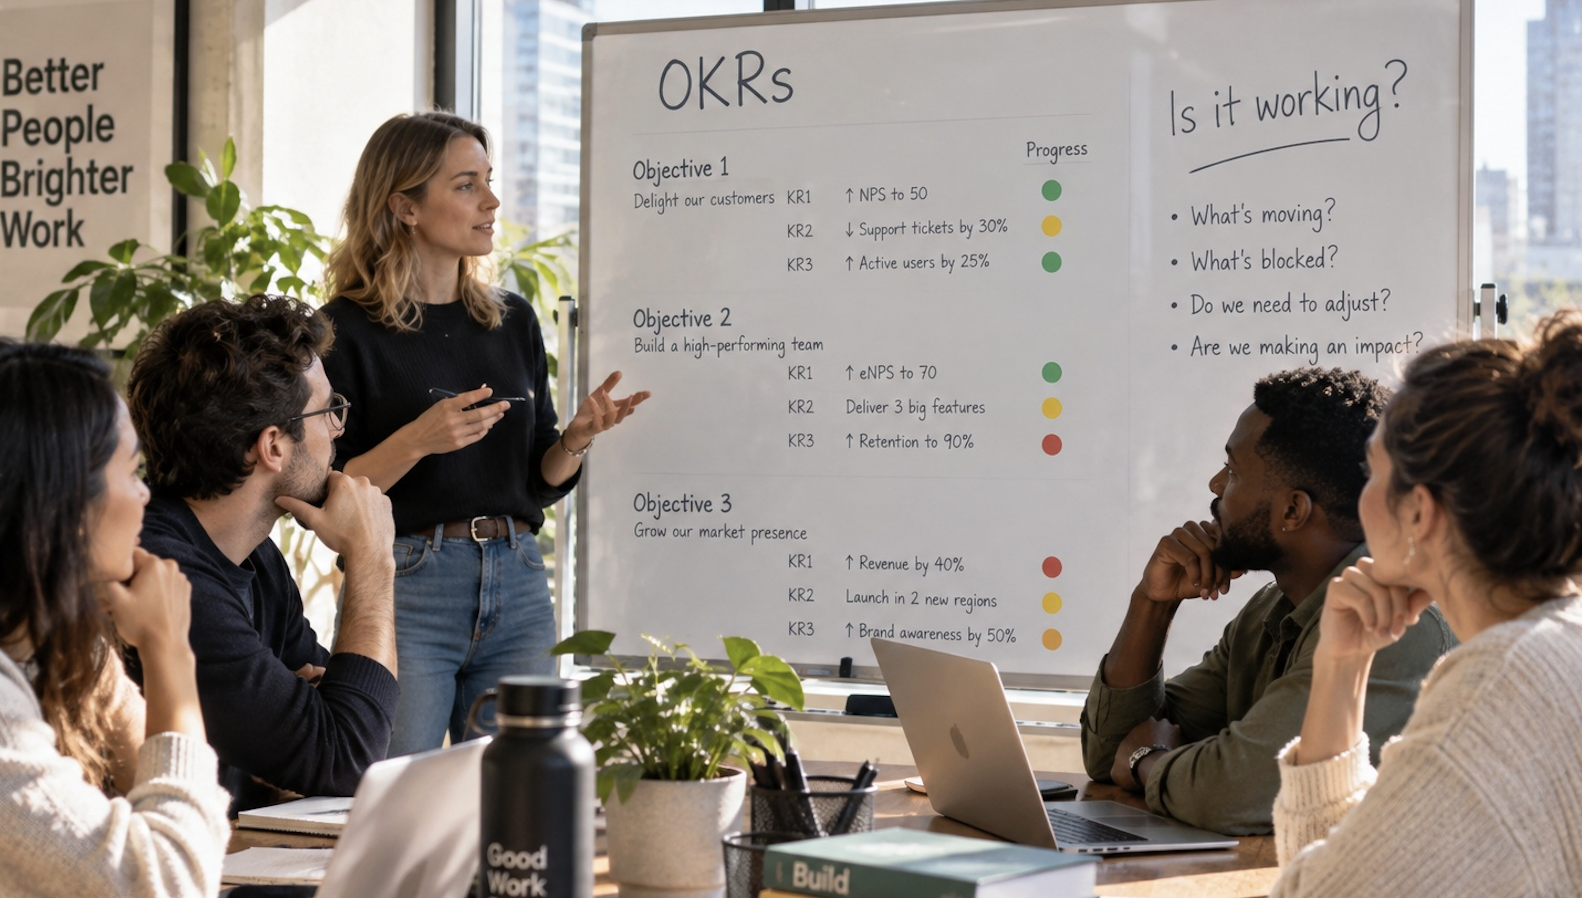
Teams that report progress weekly complete 43% of their OKRs. At a monthly cadence that falls to 27%, and with no fixed rhythm it drops below 10%. That gap is set before anyone opens the deck — by how often the reporting happens and whether it captures the trajectory of a goal or just its status on one day.
An OKR report answers one question for the people reading it: are we going to hit these goals, and if not, what needs to change while there's still time. A status snapshot doesn't answer that. A number that read 40% last week and reads 45% this week tells a different story than the same 45% arrived at from 60% — one is climbing, one is sliding, and the current value hides which.
Good reporting captures the direction of travel, sends it on a rhythm fast enough to act on, and strips out everything that doesn't lead to a decision. The seven steps below cover what to include, how often, and what to leave out.
Step 1: Report the Trajectory, Not the Status
A single number is a snapshot, and a snapshot can't tell you whether a goal is recovering or collapsing. A key result at 45% is on track if it was 30% last week and failing if it was 60%. Status hides the direction; trajectory shows it.
Report every key result with its movement since the last report, not just its current value. The reader's real question is whether the line is pointing at the target, and that only appears when each update sits next to the one before it. A report built from a running check-in history shows the slope; a report typed fresh each time shows a dot. This is why progress tracking that stores each update beats a spreadsheet overwritten weekly — the history is the report.
Step 2: Lead With What's Off Track
Attention is the scarcest thing in any review. A report that opens with wins buries the one thing the reader needs to act on, and by the time they reach the at-risk goal the meeting is half over.
Put the goals that are behind or drifting off pace at the top. Everything on track can be scanned or skipped; the goals in trouble are where decisions get made. A report ordered by risk rather than by team or sequence puts the reader's attention where it changes outcomes — the same principle that makes a mid-quarter review useful and a board update readable.
Step 3: Report Outcomes, Not Activity
Across the OKRs Tool platform of 876 organizations and 20,952 key results, 52% of key results are tasks or KPIs in disguise — "shipped the feature," "ran the campaign" — rather than the change the work was meant to produce. A report full of those is a report of activity, and activity reads as progress even when the outcome hasn't moved.

A green bar for a shipped task tells leadership nothing about whether it worked. Report the number the work was supposed to change — signups, retention, revenue — not the fact that the work happened. If a key result can be marked done without the business being any different, it doesn't belong in the report as a win, which is why writing key results as outcomes in the first place is what makes them reportable. This is the difference between outcomes and outputs applied to what you choose to show.
Step 4: Match the Cadence to the Decision
Reporting cadence is not a formatting choice. It sets the ceiling on how much the report can do.
Teams that report weekly complete 43% of their OKRs, against 27% at a monthly cadence and under 10% with no fixed rhythm, per the 2026 OKR Benchmark Report. The reason is timing: a weekly report surfaces a slipping goal while a quarter of runway remains, and a monthly one surfaces it after the window to fix it has closed. A polished monthly deck can't recover the signal a rough weekly update captures in time. Set the reporting cadence to weekly for team-level tracking — a Slack update keeps it low-friction — and reserve the monthly or quarterly roll-up for the wider audience that only needs the trend.

Step 5: Separate the Report From the Review
Reporting and reviewing are two jobs, and collapsing them into one meeting wastes the expensive one. A status read-out consumes a room of senior people to transmit information that could have been read in advance.
Send the report ahead of time and let people absorb the numbers on their own. Use the meeting for the part that needs the room: the decisions, the trade-offs, the blockers only a group can clear. The report is the input; the review is the decision.
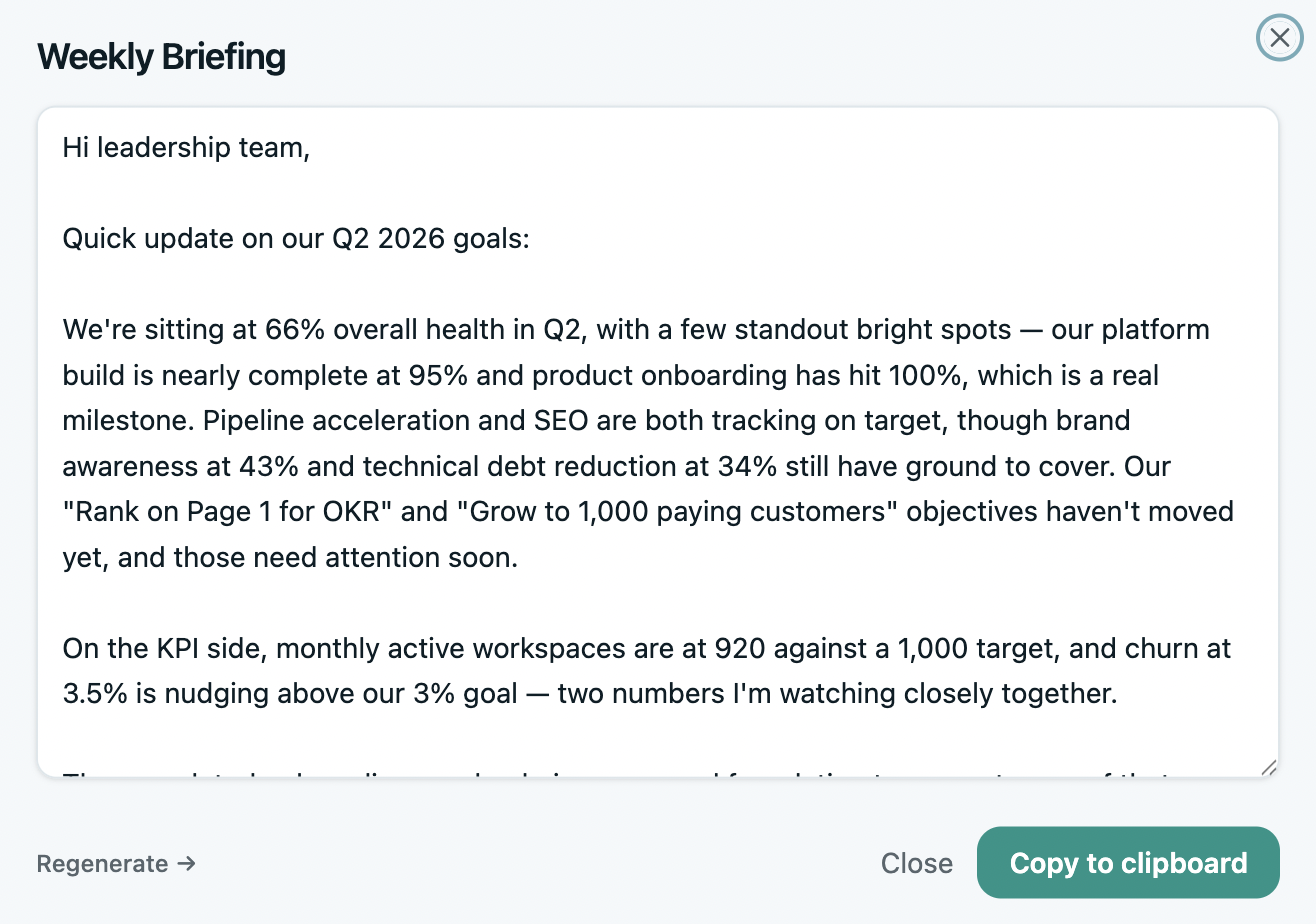
When the numbers arrive in advance, the meeting starts at "what do we do about the at-risk goal" instead of "here is the at-risk goal."
Step 6: Report by Owner
50% of key results are set with no named owner, and a report on an unowned goal has no one to question and no one to act. Accountability that's diffuse in the goals is diffuse in the report.
Every line in the report should carry a single owner — the person who can explain the number and the plan behind it. Teams that assign one owner per key result complete 26% more of their goals, and reporting is where that ownership becomes visible: the report names who's accountable for each trajectory, so a question about a slipping goal has a clear person to reach. A report by owner turns a status document into a set of commitments.
Step 7: Close the Loop at Cycle End
The final report of a cycle does more than score the quarter — it feeds the next cycle's planning. What got hit, what got missed, and why are the raw material for setting better goals next quarter.
Teams that run a structured retrospective at cycle close complete 30–45% more of their goals the following quarter, and completion climbs from 51% in cycle one to 79% by cycle five as those lessons compound up the maturity curve. The end-of-cycle report is where that learning gets captured or lost. Report the scoring against each key result, the reason behind each result, and the one change it implies for next cycle — a report that ends the quarter and starts the next one in the same document.
What Good OKR Reporting Looks Like
The seven steps reduce to a short definition. A good OKR report shows the trajectory of each goal, leads with what's off track, measures outcomes rather than activity, arrives on a weekly rhythm, precedes the review rather than filling it, names an owner on every line, and closes each cycle into the next.
None of it requires a heavier report. It requires reporting the right things on the right rhythm, which makes for a lighter document than the status decks it replaces.
Good Reporting Is Lighter Than Bad Reporting
The hardest part of good reporting is sustaining it. A weekly report assembled by hand becomes a chore, gets shortcut, and slides back to the monthly deck that arrives too late to act on.
That is the trap worth naming at the end, because it inverts the usual assumption. The instinct when reporting feels heavy is to do less of it — report monthly instead of weekly, cut the detail. The data points the other way: the lighter, more frequent report is the one that works, and the elaborate quarterly deck is the one that fails, because by the time it lands the quarter is spent. A good OKR report shows trajectory, leads with what's off track, measures outcomes, and arrives weekly — and that report is smaller than the status deck it replaces, not larger.
A tool helps here only to the extent that it removes the manual upkeep. The OKRs Tool platform builds the report from the weekly check-ins the team already does, so the weekly cadence holds without anyone assembling a deck. It's free for up to five users.
Data sources: The 2026 OKR Benchmark Report (330 organizations); OKRs Tool platform data (876 organizations, 20,952 key results).