
Strategic management is the process of setting direction, allocating resources, and executing plans to achieve organizational goals. Most organizations are competent at the first part. The data shows they consistently fail at the last. This guide covers every stage of strategic management — with the external research and proprietary benchmark data that explain where organizations lose the most value.
Most organizations can write a strategy.
The annual planning retreat produces a clear set of priorities. Leadership aligns on the vision. The slides look compelling. The strategy deck gets shared.
And then nothing happens.
67% of well-formulated strategies fail due to poor execution, not flawed thinking. McKinsey research shows that 70% of strategic transformations fail at the execution stage, not at the strategy stage. The strategy was right. The execution was absent.
This is the defining problem of strategic management. Not formulation — execution. Not vision — translation. The gap between what organizations plan and what they deliver is the most expensive gap in business.
A consistent 37% gap between expected and actual results from strategic plans compounds year after year — a shortfall that shows up regardless of how strong the strategy was on paper.

This guide covers the complete strategic management process — what it is, the frameworks that work, why most strategies fail, and the strategy execution system that closes the gap — drawing on external research from McKinsey, HBR, PMI, and ClearPoint, alongside our own 2026 OKR Benchmark Report data from 330 organizations.
What Is Strategic Management?
Strategic management is the ongoing process of formulating, implementing, and evaluating strategies that enable an organization to achieve its goals.
It operates across three levels:
- Corporate strategy — what businesses or markets to be in
- Business strategy — how to compete within those markets
- Functional strategy — how each department contributes to the business strategy
The word "management" is important. Strategic management isn't a planning event — it's a discipline. It includes the processes, habits, and systems that keep strategy connected to daily execution, quarter after quarter.
Strategic Management vs Strategic Planning
These terms are often used interchangeably but describe different things:
Strategic planning is the process of deciding where to go — setting vision, mission, goals, and priorities for a defined period.
Strategic management is the ongoing process of making sure you actually get there — translating the plan into action, tracking progress, adjusting course, and building the organizational capability to execute consistently.
Most organizations invest heavily in strategic planning. Very few invest adequately in strategic management. The data shows what that imbalance costs.
The Strategic Management Process: 5 Stages
Stage 1: Environmental Analysis
Before setting strategy, organizations need an accurate picture of where they are — internally and externally.
External analysis: What opportunities and threats exist in the market? What is the competitive landscape? What macro factors (regulatory, technological, economic) are shaping the environment?
Internal analysis: What are the organization's genuine strengths and capabilities? Where are the gaps? What resources are available to pursue the strategy?
The most widely used frameworks at this stage:
- SWOT (Strengths, Weaknesses, Opportunities, Threats) — quick, accessible, useful for first-pass analysis
- PESTEL (Political, Economic, Social, Technological, Environmental, Legal) — external environment scan
- Porter's Five Forces — competitive dynamics within an industry
- VRIO (Value, Rarity, Imitability, Organization) — internal capability assessment
77% of firms using the VRIO framework sustained competitive advantages longer.
The common failure at this stage: analysis paralysis. Organizations spend so long analyzing the environment that by the time the strategy is written, the context has shifted. Environmental analysis should inform strategy, not replace it.
Stage 2: Strategy Formulation
Strategy formulation is the process of deciding what to pursue, what to deprioritize, and how to allocate resources to achieve the chosen strategic goals.
The ideal strategic portfolio has 5–9 strategic goals. Plans with fewer than 20 strategic elements achieved a 68% high performer rate. Plans with 60+ elements achieved an 8% completion rate.
The ClearPoint data from 20,000+ real strategic plans makes the constraint case unambiguously: more goals means fewer results. The discipline of choosing 5–9 strategic priorities isn't a limitation — it's the mechanism through which organizational focus is created.

Good strategy formulation answers three questions:
- What is our theory of competitive advantage?
- What are the 5–9 outcomes that, if achieved, would confirm we're winning?
- How will we allocate resources differently than we did last year?
The last question is the test. A strategy that doesn't change resource allocation isn't a strategy — it's a description of current activity with an optimistic title.
Stage 3: Strategy Implementation
Implementation is where strategy dies.
Only 5% of employees understand their company's strategy, creating a cascade of misalignment that dooms even the most brilliant plans from the start.
68% of leaders believe their teams are not fully aligned with the organization's strategic direction. 74% of executives admit their strategies are not well-translated into concrete actions.
The implementation failures are consistent across organizations and industries:
The cascade problem. Strategy stays at the top. A CEO announces "we need to be more customer-centric." But what does that mean for a supply chain manager on a Wednesday afternoon? Without translating strategic intent into team-level outcomes and individual commitments, strategy remains an inspiring abstraction. Cascading OKRs is the mechanism that closes this gap.
The measurement problem. Only 27% of employees and 42% of managers have access to their company's strategic plan. If teams can't see the strategy, they can't execute it — regardless of their willingness or capability. An alignment map makes the connection visible without a meeting.
The ownership problem. Strategic goals without named owners are strategic intentions. The ownership of each strategic initiative — not the team, one named person — is the mechanism that turns plans into accountability.
The cadence problem. 85% of leadership teams spend less than one hour per month discussing strategy. When strategy review happens monthly or quarterly, course correction happens months after the problem appears. By then, recovery is significantly harder.
Stage 4: Strategy Evaluation and Control
Strategy evaluation is the ongoing process of measuring progress against strategic goals and adjusting when results deviate from plan.
The most effective evaluation systems have three components:
Leading indicators — metrics that predict whether the strategy is on track before financial results confirm it. Customer acquisition trends, product usage metrics, pipeline health. The distinction between KPIs and OKRs is critical here — KPIs measure ongoing health, OKRs measure deliberate change.
Lagging indicators — financial and market results that confirm whether the strategy delivered. Revenue growth, market share, profitability.
Decision triggers — defined thresholds that prompt explicit conversation about whether to stay the course, adjust the approach, or change direction.
Without decision triggers, evaluation becomes reporting. Progress gets documented but not acted on. The strategy review meeting becomes a status update rather than a decision-making session.
Stage 5: Strategic Renewal
Every strategy has a shelf life.
72% of executives cite AI and automation as a primary driver pushing them to rethink their business model and operating approach. Market conditions shift. Competitive landscapes evolve. Technology disrupts established advantages.
Strategic renewal is the process of periodically reassessing whether the current strategy still fits the environment — and systematically building the capability to execute the next strategy before the current one expires.
The organizations that manage strategic renewal well don't wait for crisis to prompt change. They build evaluation checkpoints into the strategic management cycle that ask not just "are we executing the strategy?" but "is this still the right strategy to execute?"
The Major Strategic Management Frameworks
OKRs — Objectives and Key Results
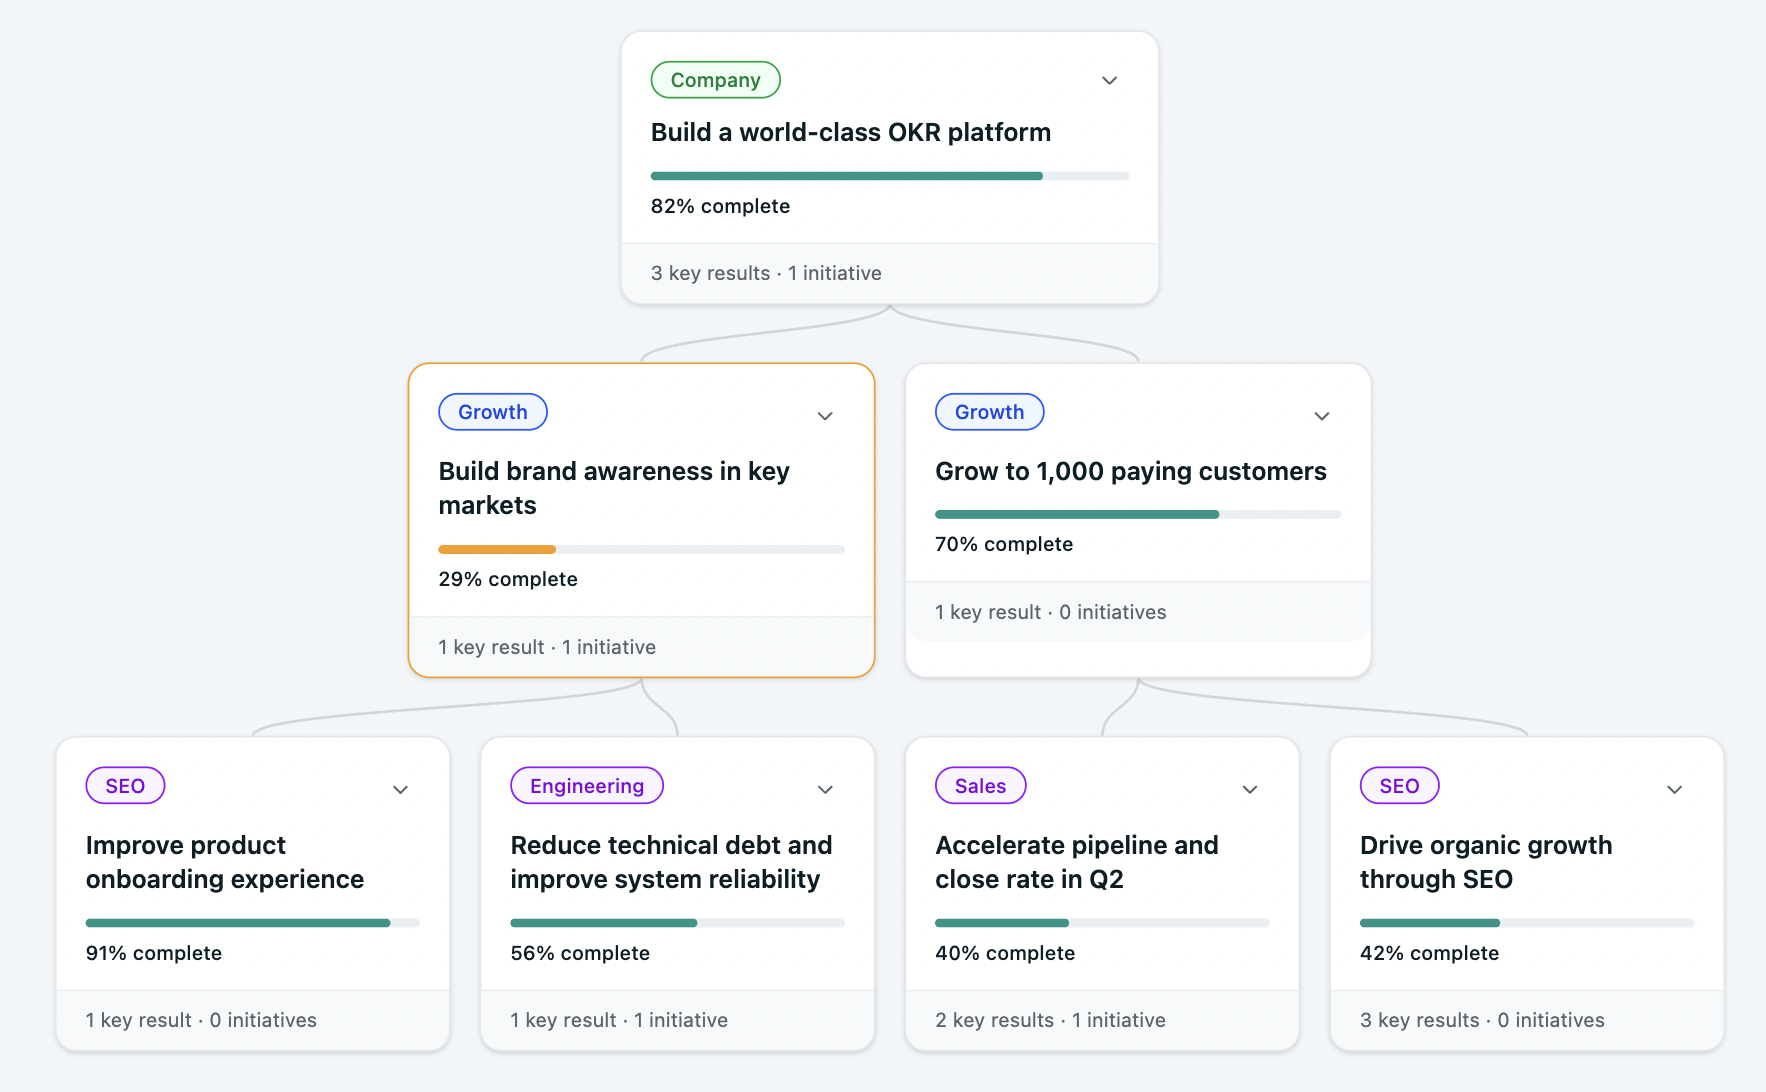
OKRs are the most widely adopted framework for translating strategic goals into quarterly execution. Used by Google, LinkedIn, Spotify, and hundreds of growing organizations, they provide the connective tissue between strategic intent and daily work.
The structure: company-level Objectives set the strategic direction. Team-level Key Results define how each function contributes. Weekly check-ins maintain visibility. End-of-cycle retrospectives build learning.
The benchmark data from 330 organizations: companies that implement OKRs well generate a 1:25 return on investment — with 98% reporting measurable revenue growth and 95% reporting reduction in wasted work. The full data is in our ROI of OKRs: 2026 Benchmark Report.
OKRs work as a strategic management tool because they solve the cascade problem structurally: every team's goals connect visibly to company priorities, and every Key Result has a named owner with weekly accountability.
The Balanced Scorecard
The Balanced Scorecard, developed by Kaplan and Norton, translates strategic objectives into a set of performance measures across four perspectives: financial, customer, internal processes, and learning and growth.
Its primary contribution to strategic management: it forces organizations to measure the drivers of financial performance — not just the financial results themselves. A company might be hitting revenue targets while losing customer satisfaction ground that will cost them in three quarters. The BSC makes that lag visible.
The limitation: the BSC is an excellent measurement framework but a weak execution framework. It tells you what to track. It doesn't create the weekly discipline needed to move the numbers.
Strategy Maps
Strategy maps (an extension of the Balanced Scorecard) provide a visual representation of how an organization creates value — showing the cause-and-effect relationships between strategic objectives across the four BSC perspectives.
Their value is in alignment conversations. A strategy map makes it possible to show a marketing team, an engineering team, and a customer success team how their work connects to the same strategic outcome — in a format that doesn't require a 60-minute presentation to explain.
SWOT and Scenario Planning
SWOT remains the most widely used strategic analysis tool — accessible, fast, and sufficient for most first-pass environmental assessments. Its weakness is its static nature: a SWOT captures the environment at a moment in time but doesn't model how conditions might change.
Scenario planning addresses this by asking "what if?" — developing multiple plausible futures and stress-testing the strategy against each one. For organizations operating in volatile environments (technology disruption, regulatory change, geopolitical uncertainty), scenario planning is the risk management layer that most strategic plans lack.
Why Strategic Management Fails: The Data
The research on strategic management failure is extensive and consistent. The same problems appear across industries, organization sizes, and geographies.
The top barrier to strategic execution, cited by more executives than any other factor (35%), is a disconnect between planning and execution. Only 50% of projects succeed.
Only 10% of organizations achieve at least two-thirds of their strategic objectives. 61% of executives admit their firms struggle to bridge the gap between strategy formulation and day-to-day implementation.
Only 12.5% of strategic projects are ever completed.

Breaking down the failure modes:
1. Strategy stays at leadership levelThe cascade from boardroom to team level almost never completes. Only 5% of employees understand their company's strategy. When 95% of the people responsible for executing strategy don't know what it is, execution failure is structural, not motivational. OKR alignment is the structural fix.
2. Goals proliferate until nothing is prioritizedThe average number of milestones per strategic plan nearly doubled between 2017 (32.87 milestones) and 2024 (56.11 milestones). More goals produce fewer results. Plans with 60+ elements achieved an 8% completion rate. The benchmark on how many OKRs to set confirms: 1–2 objectives per team are twice as likely to be achieved.
3. Reviews are too infrequent to course-correct85% of leadership teams spend less than one hour per month discussing strategy. With monthly or quarterly reviews, problems compound for weeks before anyone acts. Teams with weekly check-in habits complete 43% more goals than those reviewing monthly or ad hoc.
4. Ownership is diffuseStrategic initiatives assigned to "the leadership team" or "all departments" have no single accountable person. The result: everyone assumes someone else is responsible. Our research across 330 organizations shows that 50% of all strategic goals have no named owner — the single most fixable failure mode in strategic management.
5. The measurement layer is activity-based, not outcome-basedOrganizations track what was done — campaigns launched, features shipped, meetings held — rather than what changed. Our analysis of 7,857 Key Results found that 52% were tasks or KPIs in disguise, measuring activity rather than strategic outcomes.
The Strategic Management–Execution Connection
The organizations that close the strategic management execution gap share a set of consistent behaviors — not frameworks, not tools, but habits.
Translate strategy into quarterly outcomes
Annual strategic plans are too long-horizon to drive weekly behavior. The organizations generating the highest strategic returns translate their annual priorities into quarterly OKRs — 12-week cycles that are short enough to stay urgent and long enough to produce meaningful progress.
The cascade from annual strategic goal to quarterly company OKR to team Key Result is the mechanism that closes the alignment gap. When done well, every team member can draw a direct line from their weekly work to the organization's most important strategic priority.
Review strategy weekly, not quarterly
The counterintuitive finding from our benchmark: teams that review progress weekly complete 43% more goals than those reviewing monthly or ad hoc. 85% of leadership teams spend less than one hour per month discussing strategy. The gap between those two facts — 43% more completion vs 1 hour per month — is where most strategic management value gets lost.
A 20-minute weekly check-in, focused on what moved, what's at risk, and what needs a decision, produces more strategic traction than a quarterly offsite.

Name one owner per strategic initiative
The research and the proprietary data point to the same finding. 82% of leaders admit that poor strategic alignment is their biggest barrier to growth. Our data shows that teams with a single named owner per Key Result see 26% higher completion rates than those with shared or vague accountability.
One person per strategic initiative — not responsible for all the work, but responsible for the outcome.
Build the retrospective loop
Teams that run structured end-of-cycle retrospectives complete 30–45% more goals the following quarter. The retrospective is where strategic management improves — where assumptions get tested, where failure patterns get diagnosed, and where the next cycle's strategy gets sharper.
High performers have 5.83 measures per goal and 2.50 projects per goal. Low performers have 3.43 measures per goal and 1.08 projects per goal. The higher project count per goal among high performers reflects a key discipline: attaching multiple execution paths to each strategic outcome, rather than betting everything on a single initiative.
Strategic Management Tools and Software
The right tool for strategic management depends on the stage of the organization and the complexity of the strategy being executed.
For growing organizations between 50–200 people, the highest-ROI investment is purpose-built OKR software that makes the weekly check-in habit structurally easy. Our benchmark data shows organizations using purpose-built goal management software generate a 1:88 return compared to 1:25 on spreadsheets. The gap isn't the software cost — it's the weekly execution discipline that purpose-built tools make sustainable without manual overhead.
Strategic Management in Practice: What High Performers Do Differently
The research paints a consistent picture of what distinguishes organizations that execute strategy successfully from those that don't.
They set fewer goals. The ideal portfolio has 5–9 strategic goals. High performers don't have longer strategy documents — they have more ruthlessly prioritized ones. Every goal past nine dilutes the focus that makes execution possible.
They cascade to the team level. Strategy that lives only at the leadership level never reaches the work. High-performing organizations build an explicit cascade structure — company strategy to department OKRs to team Key Results — so that every team can see how their work connects to the organizational priority.
They make strategy visible weekly. The single most consistent differentiator between high-performing strategic management and low-performing is review frequency. Not the quality of the strategy. Not the sophistication of the framework. How often the team actually looks at it. The weekly report and OKR check-in are the operational mechanisms that make this habitual.
They separate strategy from operations. Strategic management and operational management require different rhythms. Operational reviews (daily standups, weekly metrics) track the health of current execution. Strategic reviews track progress toward goals that change the business. High performers run both — and don't let operational urgency crowd out strategic conversation.
They name owners explicitly. Strategic goals often fail because no one is responsible for achieving them. If everyone's accountable, no one is. High-performing organizations assign one person — not a committee, not a team — to each strategic initiative. That person tracks it, escalates when it stalls, and owns the outcome.
Strategic Management and Organizational Alignment
The alignment between strategy and daily work is the defining challenge of strategic management at scale.
Our research found that only 5% of teams have more than 75% of their weekly work tied to a strategic goal. The other 95% are operating with at least some degree of misalignment — doing work that may be important but isn't clearly connected to where the organization is trying to go.
61% of respondents acknowledge that their firms often struggle to bridge the gap between strategy formulation and its day-to-day implementation.
The alignment map — a visual representation of how every team's work connects to company strategic priorities — is the infrastructure that closes this gap without requiring constant coordination meetings. When alignment is visible, misalignment is surfaced early. When it's invisible, it compounds quietly until it shows up in missed results.
Strategic Management for Growing Organizations
Strategic management looks different at 20 people than it does at 200 — and different again at 2,000.
At 20–50 people: The founder or CEO is still the primary strategic management mechanism. Strategy is communicated informally. The risk is that strategy lives in the founder's head and never gets systematized. The first strategic management investment worth making: a quarterly OKR cycle with written goals, named owners, and weekly check-ins.
At 50–200 people: This is the stage where informal strategic management consistently breaks down. The team has grown past the point where alignment happens through proximity and conversation. Department heads are making resource allocation decisions without a shared strategic framework. The investment required: a formal cascade structure, purpose-built tooling, and a weekly review rhythm that leadership maintains without exception.
Companies with formal strategic management processes outperform peers by 20% in revenue growth.
At 200+ people: Strategic management requires dedicated infrastructure — a strategy function, a BSC or OKR system that covers all levels of the organization, and a leadership review cadence that's protected from operational override. The risk at this stage is bureaucratization — strategy management becoming a compliance exercise rather than an execution discipline.
The Strategic Management Execution Stack
For organizations ready to close the gap between strategic intent and execution, here's the operating system that the benchmark data consistently supports:
1. Annual strategic priorities (5–9 goals). Set once a year. Leadership-owned. Defines where the organization is going and what winning looks like over the next 12 months.
2. Quarterly OKRs (cascade to teams)Translates annual priorities into 12-week execution cycles. Company OKRs set direction. Team OKRs interpret contribution. Every Key Result has a named owner.
3. Weekly check-ins (20 minutes, same time). The connective tissue between strategy and daily work. Four questions: what moved, what's at risk, what's the priority this week, where do we need help. Teams with this habit complete 43% more goals.
4. Monthly leadership review (60 minutes). Are the quarterly OKRs on track? Are any strategic assumptions no longer valid? What decisions need to be made at leadership level? The OKR dashboard should make this review possible without manual preparation.
5. Quarterly retrospective (60 minutes). Score the OKRs honestly. What drove results? What blocked progress? What does next quarter's strategy need to look like given what we learned? Teams that run consistent retrospectives complete 30–45% more goals the following quarter.
This stack — annual → quarterly → weekly → monthly → quarterly — is the operational rhythm of strategic management in high-performing organizations. The organizations generating a 1:25 OKR return aren't doing anything exotic. They're doing this, consistently, cycle after cycle.
Final Thoughts
Strategic management is not a planning discipline. It's an execution discipline.
The data is unambiguous: organizations invest disproportionately in strategy formulation and underinvest in the systems, habits, and cadences that translate strategy into daily action. The 67% failure rate isn't a strategy quality problem. It's an execution infrastructure problem.
Only 12.5% of strategic projects are ever completed. That number doesn't reflect the quality of organizational ambition — it reflects the absence of the execution mechanisms that turn ambition into results.
The organizations that close the gap — that build from the 12.5% to the 70–80% that high-performing OKR programs achieve — do so through the same set of consistent behaviors: fewer goals, explicit ownership, weekly visibility, and a retrospective loop that compounds improvement every cycle.
Strategic management isn't about planning better. It's about building the system that makes execution inevitable.
External data sources: McKinsey & Company | ClearPoint Strategy — 20,000+ strategic plans | PMI 2025 Global Study — 5,800+ project professionals | Economist Intelligence Unit | Balanced Scorecard Institute
Data: The ROI of OKRs: 2026 Benchmark Report (330 respondents) and The 2026 OKR Benchmark Report (200+ organizations).