

OKR stands for Objectives and Key Results — a goal-setting framework that generates a 1:25 return on investment across 330 organizations. This is the complete guide: what OKRs are, how to write them, how to run the cycle, and what the data shows about what actually drives results.
_______________________________________________________________________________________________________
When I was first introduced to OKRs back in 2017, I hated them.
To me, they were just another way for management to track everything we do — more goals piled on top of the work we were already doing. Every Friday, being asked to update a system that felt completely disconnected from what I was actually working on.
The thing that changed it for me was realising why it felt disconnected: my OKRs had nothing to do with my actual work. I was updating them on top of my job, not as my job.
The moment I flipped that — making the OKRs the work, not a layer on top of it — everything clicked.
Now, 90% of the work I do is dedicated to moving the needle on my Key Results. Not tasks for the sake of tasks. Work that has a measurable impact on the business.
That's the difference between OKRs that drain you and OKRs that drive you.
After analyzing 7,857 Key Results written by real teams, we found the root cause:
52% were tasks or KPIs in disguise. Teams weren't failing at ambition. They were failing at the specific discipline of writing goals that measure change rather than activity. This guide fixes that — with every claim grounded in benchmark data from 550+ organizations and the OKR Intelligence Report 2026.
What Is an OKR?
An OKR is a goal-setting framework made up of two parts:
Objective — a clear, qualitative statement of what you want to achieve. Inspiring but time-bound. No numbers.
Key Results — 2–3 specific, measurable outcomes that prove the Objective has been achieved. Numbers only. Not tasks.
The structure looks like this:
Objective: Make onboarding so clear new users don't need support
Key Results:
- Increase Day 7 activation from 34% to 52%
- Reduce time-to-first-value from 6 days to 2
- Reduce onboarding support tickets by 40%
The Objective answers where are we going? The Key Results answer how will we know we got there?
OKRs sit inside a quarterly cycle — set at the start, tracked weekly, scored at cycle end, and refined in a retrospective that makes the next cycle sharper than the last.
The History of OKRs
OKRs were developed at Intel in the 1970s by Andy Grove. He adapted Peter Drucker's Management by Objectives framework — stripping out the annual review cycle and the compensation link, and replacing them with a quarterly cadence that could keep a fast-moving technology company aligned.
Grove's core insight: goals need two layers. The Objective sets the direction. The Key Results create accountability. Without both, you get either inspiring vision with no measurement, or numeric targets with no connection to strategic purpose.
John Doerr carried OKRs from Intel to Google in 1999, when the company had fewer than 40 employees. In a now-famous presentation to Google's founding team, Doerr argued that OKRs would give Google the structure it needed to scale without losing focus. He was right.
Since Google, OKRs have spread to LinkedIn, Spotify, Twitter, Dropbox, and thousands of growing organizations — not because they are trendy, but because they solve a universal problem: how to stay aligned and accountable when everything is moving fast.
The ROI of OKRs: 2026 Benchmark Report — 330 organizations — puts a number on this. Organizations using OKRs well generate a 1:25 return on investment. 98% report measurable revenue growth. 95% report reduction in wasted or misaligned work. 86% report faster decision cycles.

OKRs vs KPIs: The Distinction That Matters Most
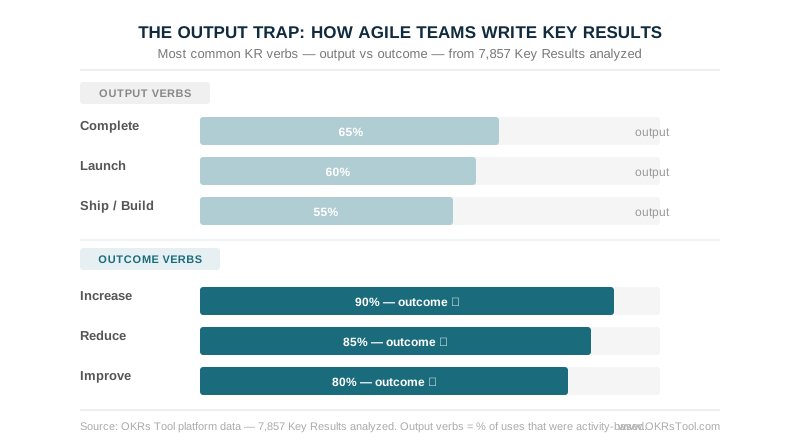
Our analysis of 7,857 Key Results written by real teams found that 52% were KPIs in disguise — metrics teams already track continuously (conversion rate, churn, revenue) rather than outcomes they intend to deliberately change.
The most common offending verbs: Complete, Launch, Conduct, Implement, Test. These describe work. They don't describe what changes as a result of the work.
The test: "Can I track this metric every week forever without it being done?" If yes — it belongs on your KPI dashboard, not your OKR.
See also: OKR vs KPI: The Full Comparison →
The Three Types of OKRs
Not all OKRs serve the same purpose. High-performing teams use three distinct types depending on the level of certainty and ambition involved.
Committed OKRs — outcomes the team expects to fully achieve. Based on stable baselines and predictable execution. Score of 1.0 is expected. Used for operational priorities where the path is known.
Aspirational OKRs — stretch goals designed to push performance beyond the current trajectory. A score of 0.7 is a success. Used for growth objectives where the ceiling isn't yet known.
Learning OKRs — goals focused on discovery rather than delivery. The output is validated learning, not a metric hit. Used when the right approach is still uncertain — testing assumptions, validating hypotheses, reducing risk before committing to outcomes.
The mistake most teams make isn't writing poor OKRs — it's applying committed OKR logic to aspirational situations. Treating every goal as a must-deliver outcome in environments where uncertainty is still high produces goals that get sandbagged, accountability conversations that kill ambition, and teams that stop setting stretch targets after the first miss.
How to Write Strong OKRs
The Objective Formula
A strong Objective is:
- Qualitative — no numbers
- Inspiring — connects to something that matters
- Time-bound — clear quarter or cycle
- Outcome-oriented — describes a changed state, not a project
Strong: Make onboarding so clear new users don't need supportWeak: Improve onboarding Q3
Strong: Build the enterprise pipeline that funds next year's growthWeak: Grow sales this quarter
The difference: strong Objectives describe the world after success. Weak Objectives describe the activity.
The Key Result Formula
Improve [business outcome] for [specific segment] from [baseline] to [target] by [end of quarter]
Strong: Increase Day 7 activation from 34% to 52% for new sign-ups by end of Q3Weak: Launch new onboarding flow
Strong: Reduce enterprise sales cycle from 95 days to 65 by end of Q4Weak: Run 40 enterprise discovery calls
The weak versions are initiatives — the specific work that might move the metric. The strong versions are the metric itself.
The Ownership Rule
Every Key Result requires one named owner — not a team, not "leadership," one person. That person is responsible for tracking it, escalating when it stalls, and owning the score at cycle end.
Our benchmark data: teams with clear single ownership per Key Result see 26% higher completion rates than those with shared or vague accountability. And 50% of all Key Results across growing organizations have no named owner at all. This is the most common and most fixable OKR failure mode.
How Many OKRs?
Teams running 1–2 Objectives per quarter are twice as likely to achieve them as those running three or more. Each Objective should have 2–3 Key Results. That means a well-structured team has 2–6 Key Results total for the quarter.
More than that and focus dilutes. Every goal added past two halves the probability of completing any of them.
OKR Examples by Function
The best OKR examples share one characteristic: they describe business change, not business activity.
For 40+ detailed examples with full KR breakdowns: Key Results Examples → · Sales OKR Examples → · Growth OKR Examples →
The OKR Cycle: How It Works Quarter by Quarter
An OKR cycle has three phases that repeat every quarter:
Phase 1: Plan (one week before the cycle starts)
Set 1–2 company Objectives. Each team interprets their contribution. Every Key Result gets a named owner. Initiatives — the specific campaigns, sprints, and experiments — get attached to each KR within week one.
The data on speed: teams that launch OKRs in under a week see up to 50% higher completion rates than those with extended rollout timelines. The cascade — from company OKRs to team Key Results — should be complete before the cycle starts, not three weeks into it.
Phase 2: Track (every week throughout the cycle)
A 20-minute weekly check-in, same time every week, focused on four questions: what moved, what's at risk, what's the priority this week, where do we need help.
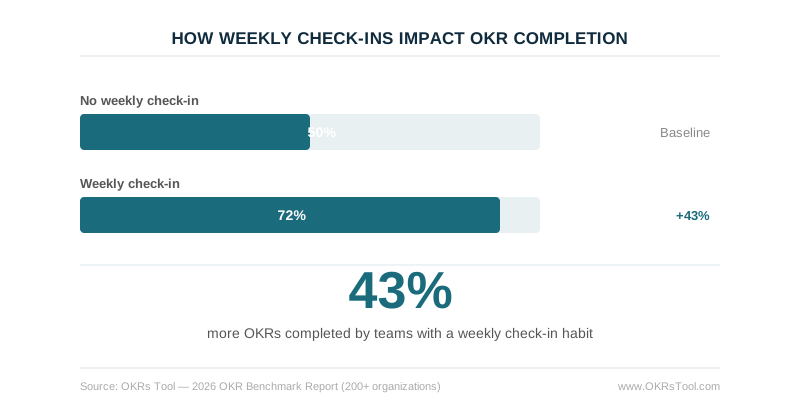
This is the most important habit in the entire framework. Teams with a weekly check-in ritual complete 43% more OKRs than those reviewing monthly or ad hoc. Teams that skip the weekly rhythm entirely are 3x more likely to abandon OKRs altogether.
At week six of a twelve-week cycle, a structured mid-cycle review asks: which OKRs are on track, which are at risk, and are any strategic assumptions no longer valid? This is the intervention point — a KR behind in week six is recoverable. One discovered in week eleven isn't.
Phase 3: Reflect (final week of the cycle)
Score each Key Result on a 0.0–1.0 scale. Run a 60-minute retrospective. Carry learnings forward into the next cycle's planning.
Teams that run structured end-of-cycle retrospectives complete 30–45% more OKRs the following quarter. The compounding effect across cycles is the most powerful argument for long-term OKR commitment.

OKR Scoring: The 0.7–0.8 Rule
OKR scoring uses a 0.0–1.0 scale applied to each Key Result at cycle end.
Consistently scoring 1.0 is a warning sign, not a success signal. It means targets are too easy. The 0.7–0.8 range reflects genuine ambition with strong execution — the conditions that generate long-term OKR returns.
A 0.65 in cycle one is exactly where you should be. The OKR maturity curve shows what happens next: cycle 1–2 teams average 51% completion. By cycle 5+, that rises to 79%. The 55% improvement doesn't come from writing better goals each quarter — it comes from the accumulated discipline of the weekly rhythm and the learning loop built in the retrospective.

The Execution Gap: Why Most OKR Programs Fail
The OKR framework is straightforward. The execution is where programs consistently lose value.
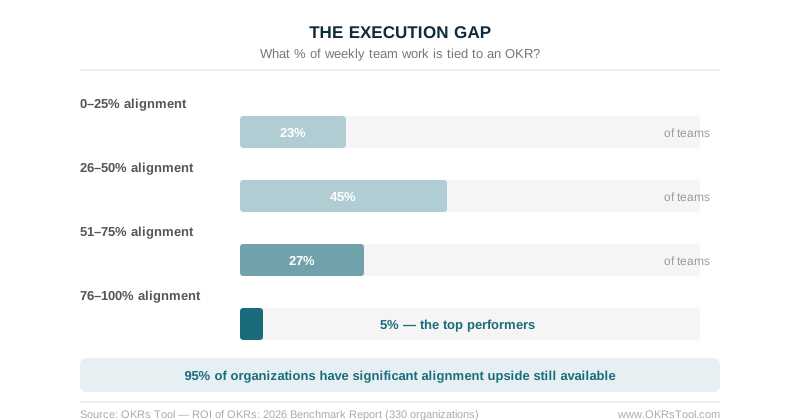
Only 5% of teams have more than 75% of their weekly work tied to a strategic goal. 65% of teams admit their OKRs aren't linked to company strategy at all. Only 49% of leaders consistently review OKRs on a weekly basis.
The failure modes are consistent across organizations and industries:
Goals without owners. 50% of all Key Results have no named owner. A goal without a named accountable person is a strategic intention — not a commitment.
The cascade that never completes. From the OKR Intelligence Report 2026: only 16% of organizations complete the full cascade — from company OKRs finalized to all team OKRs set — within the same week. 26% take 3–4 weeks. For teams taking a month, the quarter is already a third over before everyone is aligned.
The Invisible OKR. 7% of off-track Key Results are simply abandoned — informally stopped tracking with no revision, no escalation, and no consequence. The goal exists on the dashboard. Nobody is watching it. A standing rule prevents this: every off-track KR must leave the mid-cycle review with one of three outcomes — revised, escalated, or formally closed.
The output trap. 52% of Key Results are tasks or KPIs in disguise. Teams track what was done rather than what changed. Campaigns launched, features shipped, meetings held — instead of revenue grown, retention improved, activation increased.
AI and OKRs: What the 2026 Data Shows

The OKR Intelligence Report 2026 — 222 organizations — is the first study to measure how AI is actually used in OKR programmes.
83% of organizations are actively using AI in their OKR process. The split between writing (51% impact) and analysis (49% impact) is closing fast. Teams using AI for both layers accept a low score on missed goals only 14% of the time — compared to 35% for teams using AI for writing only.
The highest-value AI applications in OKR programmes:
Writing: Role- and context-aware OKR drafts that start from outcomes rather than tasks — directly addressing the 52% KPI-as-KR problem.
Analysis: At-risk flagging based on progress velocity and update frequency — surfacing the Invisible OKR pattern before it compounds. Misalignment detection across team OKRs. End-of-cycle synthesis that identifies patterns across check-in data.
The #1 AI concern: Data privacy and security — cited by 25% of respondents. Strategic goal data is sensitive. Purpose-built OKR platforms process AI requests without training on customer data.
The ROI of OKRs: The Benchmark Data
The benchmark data behind this guide comes from three independent research programmes:
ROI of OKRs: 2026 Benchmark Report — 330 organizations. The headline: OKRs generate a 1:25 return on investment. For every $1 invested in running OKRs, organizations report $25 back in revenue impact.
The breakdown:
- 98% report measurable revenue growth
- 95% report reduction in wasted or misaligned work
- 86% report faster decision cycles
- 62% see measurable ROI within a single quarter
Software matters: organizations using purpose-built OKR software generate 1:88 ROI — compared to 1:25 on spreadsheets and 1:16 on enterprise software. The gap isn't the software cost. It's the weekly execution habit that purpose-built tools make structurally easy to maintain.
OKR maturity compounds: teams in their first two cycles average 51% completion. By cycle 5+, that rises to 79%. Organizations that commit to the framework for five cycles generate returns that teams in their first cycle can't yet see.

How to Implement OKRs: The Fast-Start Framework
The benchmark data on rollout speed is counterintuitive but consistent: teams that launch OKRs in under a week see up to 50% higher completion rates than those that drag setup across several weeks. The complete implementation guide is at How to Implement OKRs →.
The fast-start version:
Day 1–2: Leadership aligns on why OKRs are being introduced and what specific problem they solve. One person named as OKR owner.
Day 2–3: Quarterly cycle agreed, weekly check-in slot booked, end-of-cycle retrospective date in the calendar.
Day 3–5: Half-day planning session. Company OKRs set. Team OKRs drafted in parallel. Every Key Result gets a named owner before the session ends.
Week 1: First check-in runs. Initiatives attached. The cycle is live.
The cascade — company → department → team — should complete before the cycle starts. From the Intelligence Report: only 16% manage this. For those who do, the alignment is structural rather than conversational.
OKRs and Performance Management
The OKR Intelligence Report 2026 found that 75% of organizations have formally linked OKR outcomes to performance decisions — 47% as one factor among several, 28% with OKRs directly influencing ratings.
The most effective performance management connects what someone delivered (OKR completion rates) with how they operated (360-degree feedback from manager, peers, and self). When these two data streams sit in separate systems, managers approximate OKR delivery from memory rather than referencing it directly.
The scoring method predicts the consequence culture: organizations using traffic light/RAG status most commonly treat missed goals as retrospective learning. Organizations using percentage completion most commonly trigger formal accountability conversations. Organizations with no formal scoring have no consistent consequence process 43% of the time.
See also: Performance Management Dashboard → · OKR Scoring →
What to Look for in OKR Software
The best OKR software is the one your team opens every week. Three features predict whether a tool generates the execution habit that drives results:
Automated weekly check-ins. Not a manual reminder — an automated nudge that runs at the same time every week without anyone scheduling it. This is what drives the 43% completion lift.
Required single ownership. A structural gate — not a prompt — that prevents any Key Result going live without a named owner. This closes the 50% no-owner gap structurally.
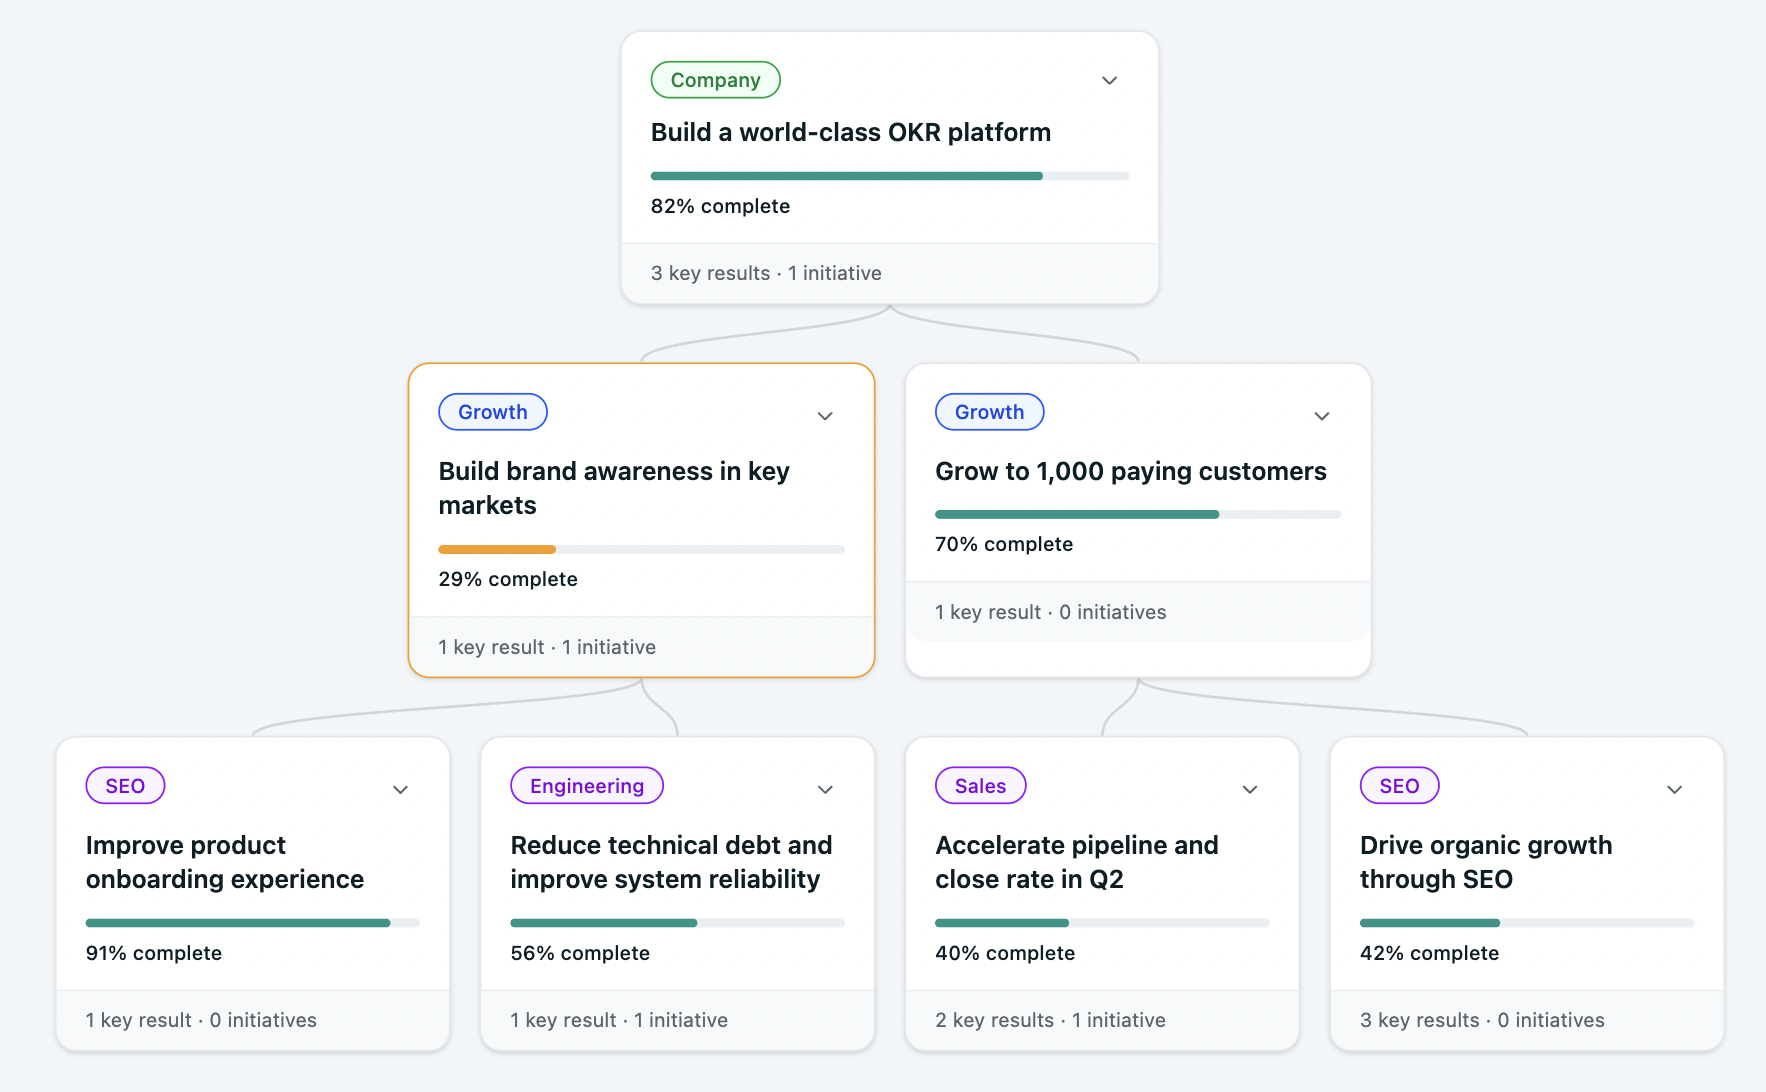
Alignment visibility. A live map showing how every team's Key Results connect to company priorities, updated automatically as goals are created and progress is tracked.
See: Best OKR Software → · OKR Software Comparison Matrix → · Free OKR Software →
OKR Quick Reference
Further Reading
Writing better OKRs: Key Results Examples → · How to Write OKRs → · OKR Format →
Running the cycle: OKR Cycle → · Weekly Check-in → · OKR Scoring → · OKR Retrospective →
Implementation: How to Implement OKRs → · OKR Implementation Plan → · Cascading OKRs →
Examples by function: Sales → · Product → · Marketing → · Engineering → · Growth →
Data and research: ROI of OKRs → · OKR Statistics → · OKR Intelligence Report 2026 → · OKR Benchmark Report →
Data: The ROI of OKRs: 2026 Benchmark Report (330 respondents), The 2026 OKR Benchmark Report (200+ organizations), OKR Intelligence Report 2026 (222 organizations), and OKRs Tool platform data (7,857 Key Results analyzed). All independent research — no OKRs Tool customers in any sample.



