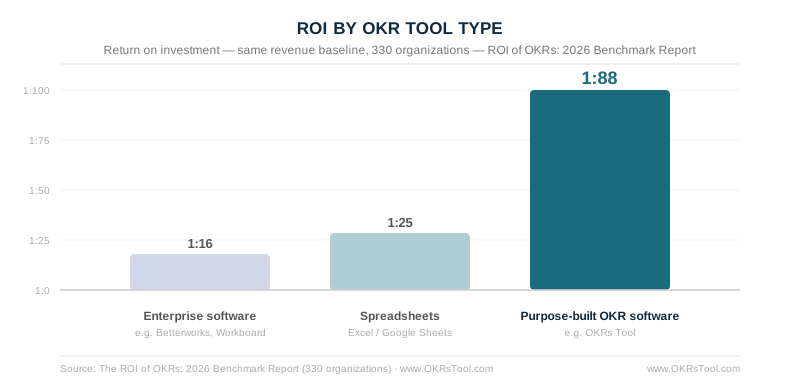
OKR software is execution infrastructure — the system that keeps strategic priorities connected to daily work through a full quarter, not just the week they were set. That structure is what produces a 1:88 ROI, versus 1:25 for the spreadsheets 67% of teams start with.
In 2020, I was running a team and struggling with the same problem that eventually sends most growing organizations toward OKR software: everyone was busy, but I couldn't tell whether the work was connected to what actually mattered.
We were tracking goals in a spreadsheet. It worked fine at first. By quarter two, the spreadsheet had 47 rows, three people were maintaining it, and nobody could tell you — in one sentence — how the product team's sprint was connected to the revenue objective we'd set in January.
That's the problem OKR software solves. Goal-setting is the easy part; the hard part is keeping strategic goals visible, owned, and connected to daily work through 12 weeks of competing priorities.
The ROI data is precise: organizations using purpose-built OKR software generate a 1:88 return on investment — compared to 1:25 on spreadsheets and 1:16 on enterprise platforms. What produces that gap is the habits the tool makes structurally unavoidable, not the software cost.
What Is OKR Software?
OKR software is a platform for setting, tracking, and aligning Objectives and Key Results across an organization. It connects strategic priorities at the company level to measurable outcomes at the team level — and keeps that connection visible through the full execution cycle.
The distinction from project management tools is fundamental. Project management tools track tasks: what needs to happen, by when, who's doing it. OKR software tracks outcomes: what change needs to happen in the business, what measurement proves it happened, and whether every team's work is visibly connected to that outcome. The OKR vs project management guide covers this in detail.
The core components of any OKR software platform:
Objectives — qualitative, inspiring goals that describe a changed state. No numbers. "Win our first enterprise accounts" not "Increase revenue by 30%."
Key Results — specific, measurable outcomes that prove the Objective was achieved. Baseline to target. "Increase enterprise MQL-to-SQL conversion from 18% to 32%."
Cascade — the hierarchy connecting company OKRs to department OKRs to team Key Results. Every team's work connects to a company priority, explicitly.
Weekly check-in — the rhythm that keeps OKRs alive between planning sessions. Progress updates, blocker escalation, priority alignment — every week, automatically.
Alignment map — a live view of every team's OKRs connected to company priorities, with status indicators. Leadership sees what's on track without calling a meeting.
OKR Software vs Spreadsheets
67% of organizations start tracking OKRs in spreadsheets. That's fine for a first cycle at 10 people. It breaks down past 20–30 people because the updates stop, the tabs fork, and half the goals end up with no owner.
The ROI gap comes from the habits, not the software cost: 43% more OKRs completed by teams with automated weekly check-ins, and 26% higher completion from required single ownership. Both are structural features a spreadsheet can't replicate.
When You Actually Need OKR Software
A spreadsheet is the right tool for a while, and switching before you need to wastes effort too. Whether you need OKR software yet comes down to your size and the symptoms below.
The size threshold is consistent: a spreadsheet holds up for a team of ten running its first cycle, starts to strain around 20 people, and stops working somewhere past 30.
The reason is structural — at ten people everyone can see everyone's goals in a glance; at thirty across five teams, no one can, and the sheet becomes a part-time job to maintain. The teams that stay on it too long are where OKR programmes fade out.
The symptoms matter more than the headcount, though. You've outgrown the spreadsheet when:
- Updates have stopped. The sheet was current in week one and hasn't been touched since week three. If the goals are already stale, the tool isn't holding the habit — and no one voluntarily opens a shared spreadsheet.
- Duplicate copies exist. Two versions with different numbers are floating around, and no one's sure which is the real one. A shared file generates more "which is current?" questions than it answers.
- Ownership is fuzzy. Half the key results have no clear owner — the single most common OKR failure, and one a blank spreadsheet field does nothing to prevent.
- You can't see what's at risk. You find out a goal missed at the quarter-end review, not in week three when there was still time to act.
- Leadership keeps asking for status. If "where do our goals stand?" means an afternoon of chasing people and rebuilding a picture by hand, the sheet has stopped being a system.
If none of those are happening yet, stay on the spreadsheet — a structured OKR Excel template is enough for a first cycle. If two or more are, the spreadsheet has already stopped working, and the cost of staying is another quarter of the goals drifting out of sight. The switch takes an afternoon; the delay costs a cycle.
The 6 Features That Drive OKR Results
Not all features in OKR software generate returns. The OKR software features guide covers the full analysis — but the six that the benchmark data consistently identifies as highest-return are specific.
Goal hierarchy and cascade. Company objectives, department OKRs, and team Key Results connected in a visible hierarchy. Every team can see how their work connects to company priorities without navigating multiple screens. Only 16% of organizations complete the full cascade in week one — the platform has to make this fast.
Required ownership per Key Result. Not a prompt — a hard gate. The Key Result can't go live without a named owner. Teams with enforced single ownership see 26% higher completion rates. This is the most common and most fixable structural failure in OKR programmes — and it has to be built into the software.

Automated weekly check-ins. Nudges that fire at the same time every week via Slack or MS Teams, without anyone scheduling them. Teams with a weekly check-in habit complete 43% more OKRs than those reviewing monthly or ad hoc. The check-in that depends on discipline eventually stops.
Live alignment map. Every team's Key Results connected to company priorities in a single view, updated automatically. Leadership sees status without pulling reports. Misalignment becomes visible before it becomes a missed quarter.
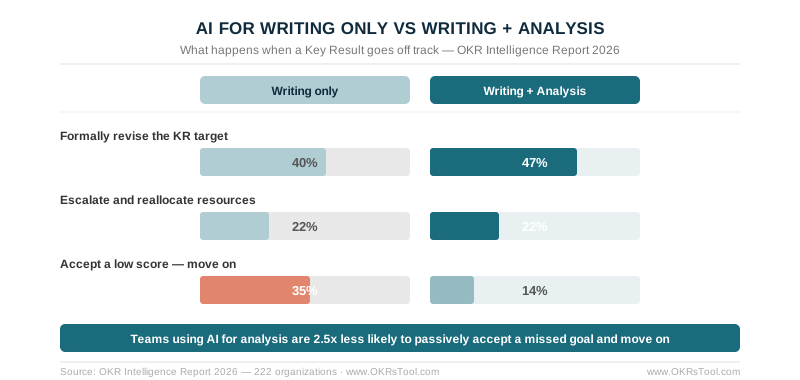
AI at-risk flagging. The OKR Intelligence Report 2026 found 83% of organizations now use AI in their OKR process. The AI that changes behaviour is the one that flags which goals are drifting mid-cycle with specific recovery suggestions, more than the one that helps write them. Teams using AI for both writing and analysis accept a low score on missed goals only 14% of the time, vs 35% for writing-only teams.
Fast setup. Teams that launch OKRs in under a week see up to 50% higher completion rates than those with extended rollout timelines. OKR software that requires a 4–6 week implementation project is working against the first-cycle completion rate from day one.
What OKR Software Looks Like in Practice
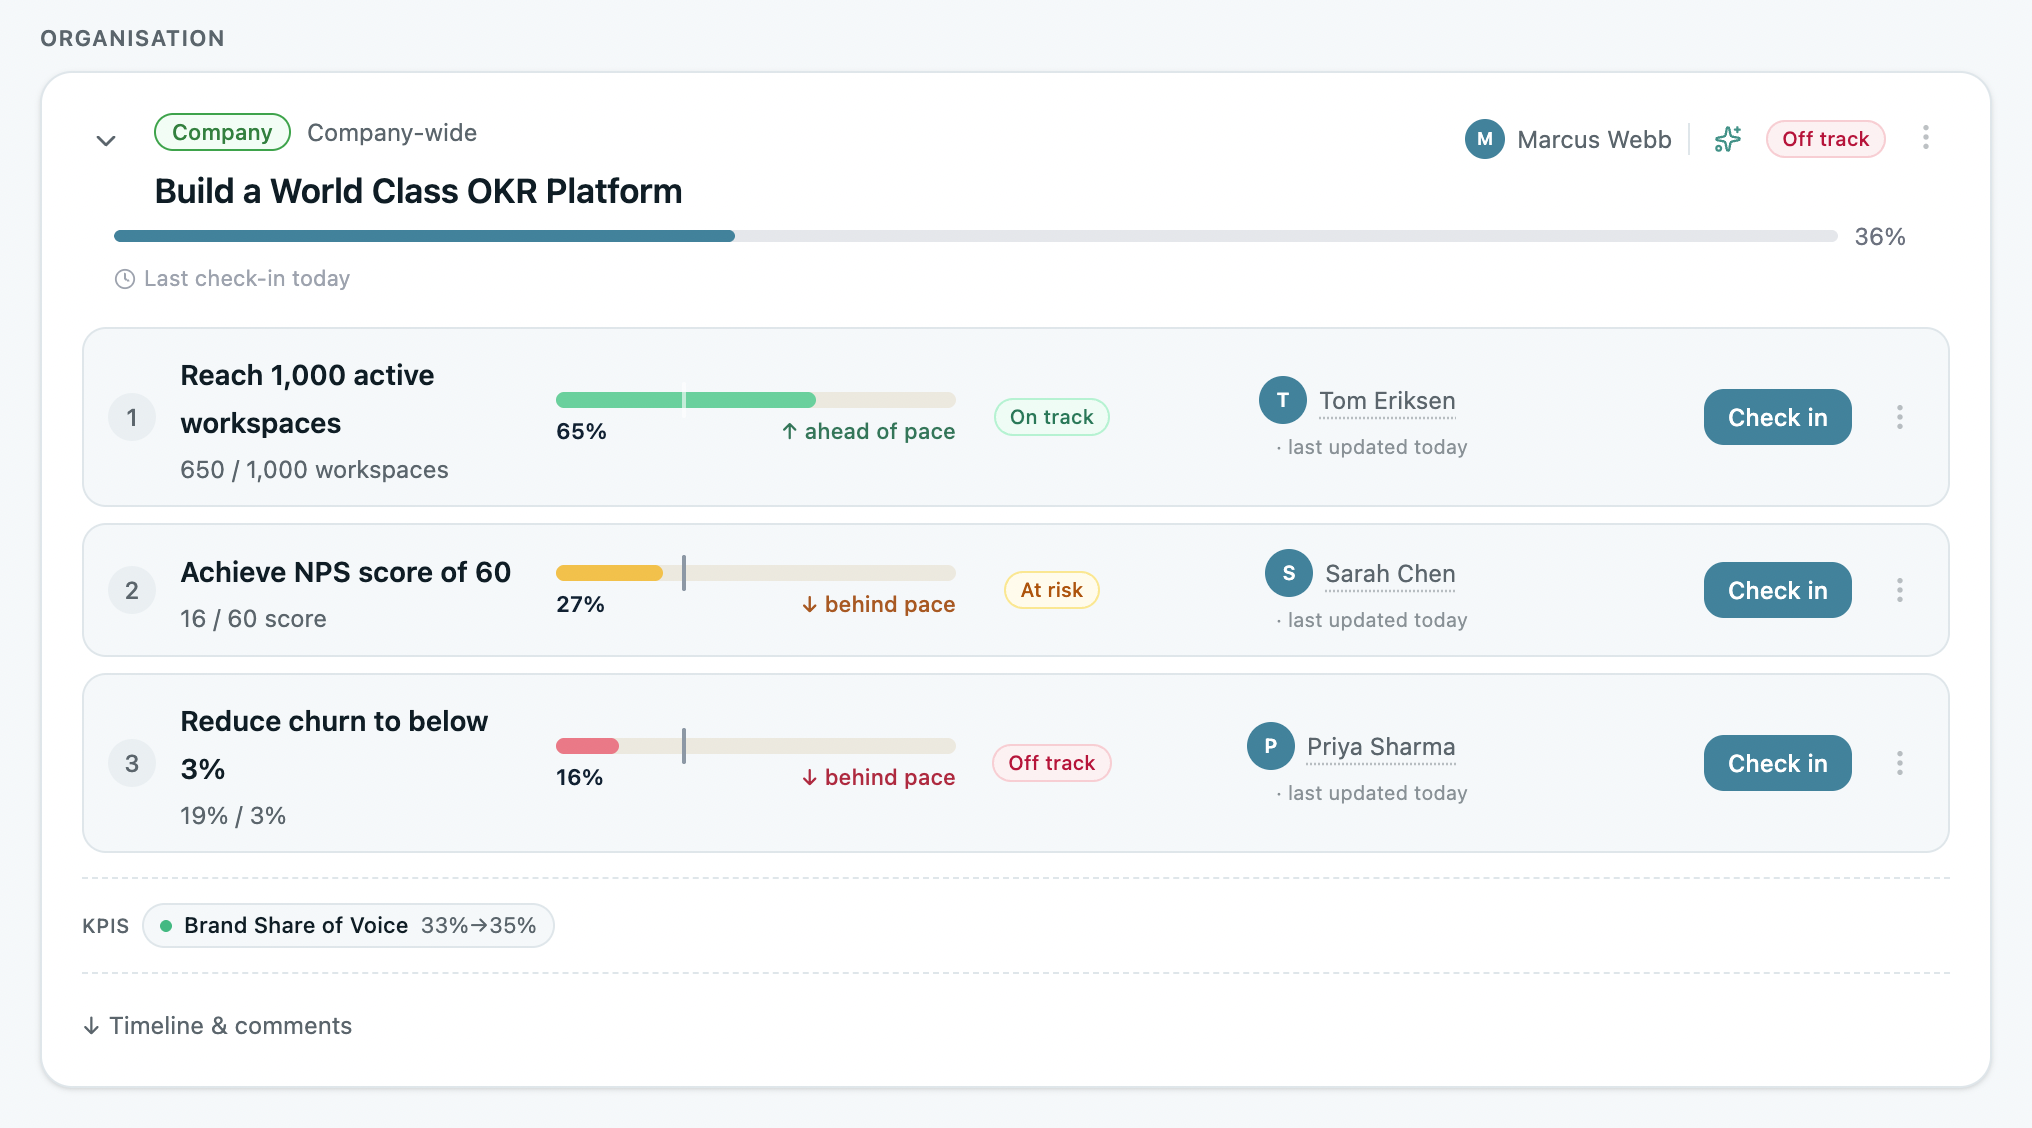
In a well-implemented OKR platform, the weekly workflow is simple. On Monday, automated nudges go to every named Key Result owner. They update progress in under five minutes. Leadership opens the alignment map and sees which teams are on track, which are drifting, and where to focus the week's attention. No status meeting required.
At the end of the cycle, the platform surfaces OKR scores (0.0–1.0 per Key Result), check-in completion rates, at-risk history, and AI-synthesized retrospective themes. The next cycle's planning session starts from data, not memory.
At OKRs Tool specifically, this connects to performance reviews and 360 feedback — KR delivery scores feed directly into review cycles without manual compilation. The OKR Intelligence Report 2026 found 75% of organizations have formally linked OKR outcomes to performance decisions. OKRs Tool makes that connection structural.
How to Choose OKR Software
The right OKR software for a growing organization at 50–200 people is the one that makes the weekly execution habit structurally unavoidable — required ownership, automated check-ins, fast setup, live alignment visibility. The how to choose OKR software guide covers the full decision framework with five pass/fail tests to run before committing.
The evaluation mistake teams make most often is choosing for feature count rather than execution fit. The longest feature list is not the strongest predictor of returns. The longest feature list is not the strongest predictor of returns. The tool that gets your team to a live first cycle in under a week — and keeps the weekly check-in running for 12 weeks without anyone having to chase it — is the tool that generates the 1:88 return.
Required Ownership, Automated Check-Ins, Live Alignment
The planning session is where OKRs feel easy — clear priorities, aligned leadership, compelling slides. What happens in week six, when the urgent has displaced the strategic and nobody has updated the goals since the first check-in, is what decides whether the strategy generates results or just documentation.
Purpose-built OKR software is the structural answer to that problem. Required ownership closes the accountability gap. Automated check-ins close the visibility gap. The alignment map closes the alignment gap. And the benchmark data — 1:88 ROI across 330 organizations — shows what closing all three gaps simultaneously produces.
Data: the ROI of OKRs: 2026 Benchmark Report (330 respondents), the 2026 OKR Benchmark Report (200 organizations), the OKR Intelligence Report 2026 (222 organizations), and OKRs Tool platform data (876 organizations, 20,952 key results).