
As teams mature in their use of OKRs, one operational decision quietly shapes everything that follows: the length of the OKR cycle.
Some teams choose monthly cycles in the name of agility. Others stretch to six months to give objectives more room to breathe. Quarterly cycles often sit in the middle by default, without much justification.
To understand whether that middle ground actually works better, we analyzed 5,000+ OKR cycles, comparing cycle length against real execution outcomes rather than intent or adoption.
What emerged was consistent and difficult to ignore. Quarterly OKRs outperform both shorter and longer cycles, not just in average progress, but in how reliably teams follow through.
What the Data Shows at a Glance
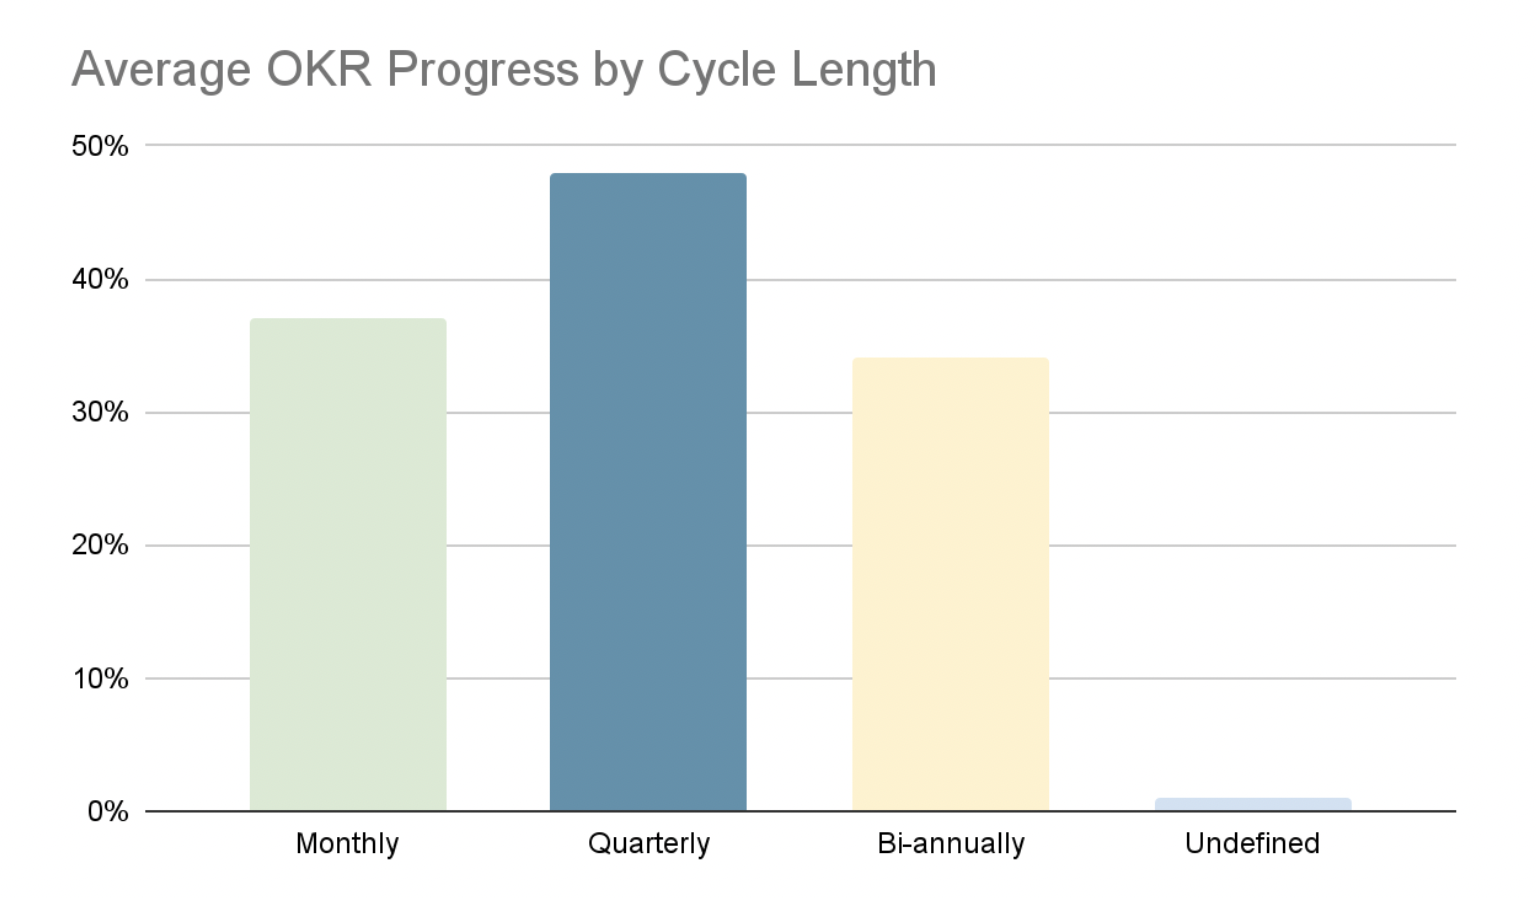
Before getting into interpretation, it’s worth grounding this discussion in the raw performance numbers. When we group OKR cycles by length and compare average progress at the end of the cycle, clear differences appear.
- Quarterly (3-month) cycles average ~46% progress
- Monthly cycles average ~37% progress
- Six-month cycles average ~34% progress
- Irregular or undefined cycles show near-zero progress
These differences are meaningful. Quarterly cycles are not only the best-performing cadence, but also the most common in the dataset, which makes the signal statistically reliable rather than driven by a small number of outliers.
Just as importantly, performance does not drop off sharply from team to team within quarterly cycles, which points to consistency rather than occasional overperformance.
Why Quarterly Cycles Hold Up Better
The strength of quarterly OKRs is not simply that teams make more progress on average. It’s that outcomes are more predictable.
In quarterly cycles, median progress closely tracks the average, which indicates that results are broadly distributed across teams.
In practice, this means the system works for most teams, not just those with exceptional execution discipline. Leaders can plan, review, and course-correct with more confidence because performance is less volatile.
Quarterly cycles appear to strike a balance that shorter and longer cadences struggle to maintain: enough time to deliver meaningful outcomes, combined with a feedback loop that surfaces problems while there is still time to act.
Where Longer Cycles Break Down
Six-month OKRs consistently underperform, and the reasons become clearer when you look beyond averages.
Longer cycles tend to show:
- The highest abandonment rate, with nearly 14% ending with zero progress
- Lower median progress, even when average progress appears acceptable
- Greater variability, where a few successes mask widespread drift
These patterns suggest that longer cycles create a false sense of safety. With more time available, urgency drops, feedback is delayed, and priorities shift without being reconciled. By the time issues become visible, the opportunity to correct course has often passed.
The result is not just lower execution, but slower learning - problems are discovered after they can no longer influence the cycle.
Why Monthly OKRs Still Fall Short
Monthly OKRs avoid some of the drift seen in long cycles, but the data shows they introduce a different set of constraints.
While teams remain active, outcomes struggle to materialize within such a short window. Setup and reset overhead take up a disproportionate share of time, leaving limited space for impact to compound.
Median progress is noticeably lower than quarterly cycles, suggesting that many teams complete work without achieving meaningful change.
Monthly check-ins can be effective. Monthly OKRs, however, rarely provide enough runway for execution-heavy goals to translate into results.
What This Means in Practice
Taken together, the data points to a clear and practical recommendation for growth-stage, execution-heavy teams.
- Use quarterly OKRs as the core execution rhythm
- Support them with monthly check-ins or milestones, not full OKRs
- Avoid six-month OKRs except for very high-level, directional intent
Quarterly cycles provide enough time to deliver meaningful outcomes while still forcing regular reflection and adjustment. They reduce abandonment, surface problems earlier, and make performance more predictable across teams.
OKR Cycle Length: Summary Comparison
When you step back and compare cadence options side by side, the tradeoffs become easier to see. The table below summarizes how each OKR cycle length performs across progress, consistency, and execution risk.
What stands out is not just that quarterly cycles perform better, but that they do so more consistently. As cadence length moves away from a clear quarterly rhythm, execution becomes harder to sustain and learning arrives too late to be useful.
Choosing a Cadence That Supports Execution
OKR cadence is not a cosmetic choice. It directly shapes how teams prioritize, execute, and learn.
The data from roughly 5,000 OKR cycles shows that quarterly rhythms consistently outperform alternatives because they match how organizations actually operate.
They balance urgency with realism, create space for outcomes to compound, and surface feedback while it can still influence decisions.
For teams that already take OKRs seriously, the question is no longer whether cadence matters. It is whether the cadence you’ve chosen is helping execution - or quietly working against it.