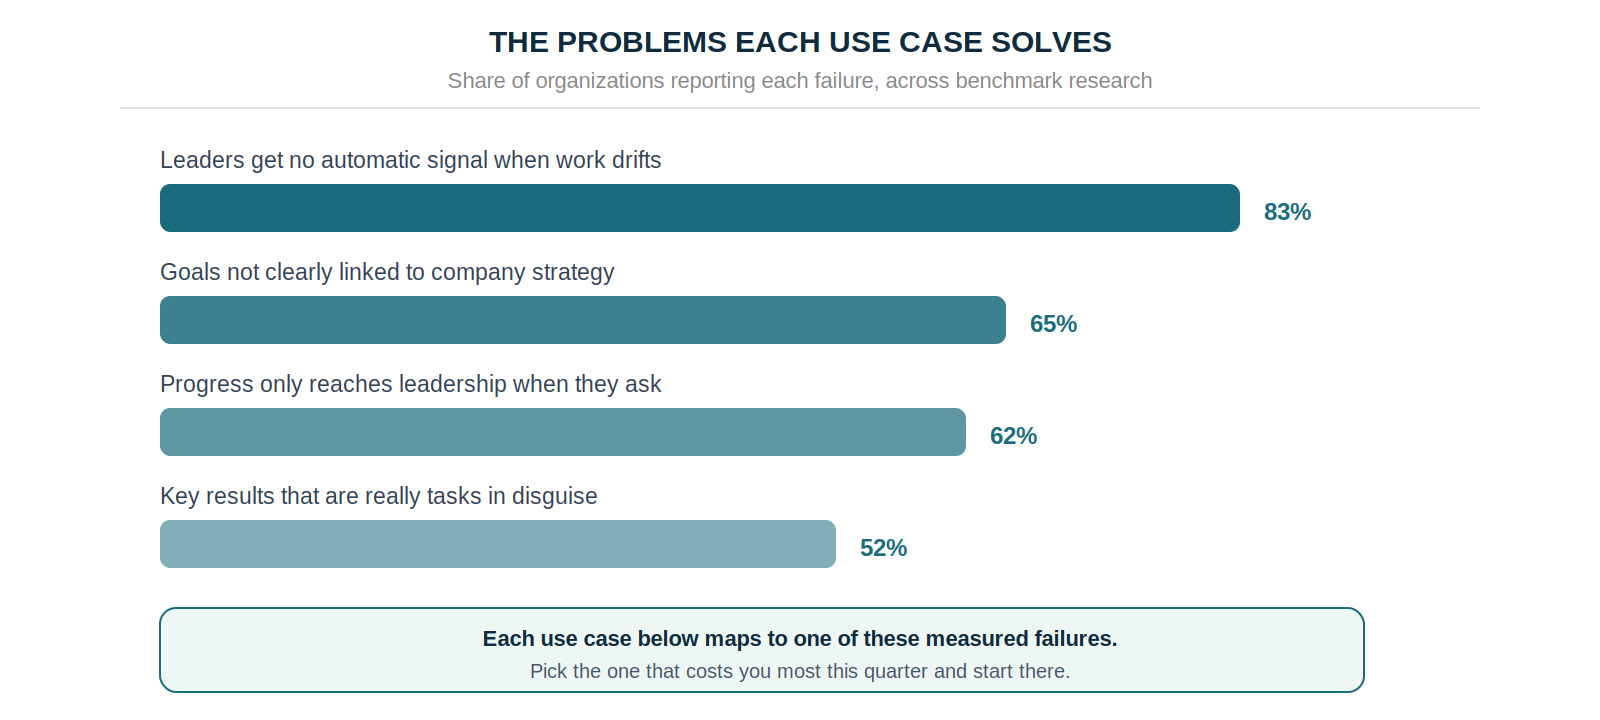
OKR software earns its cost in a handful of specific situations, not as a general upgrade. Each of the seven use cases below maps to a measured failure: 83% of leaders get no automatic signal when work drifts, 65% of teams have goals unlinked to strategy, and purpose-built tools return 1:88 against 1:25 on spreadsheets.
Goals get set, and then they stop being kept alive — which is the gap OKR software exists to close. The spreadsheet goes stale by week three, updates arrive late or not at all, and the alignment everyone agreed on in the planning session quietly becomes each team working to its own interpretation. The framework isn't what failed — the machinery around it was never built.
That's the case for OKR software, and it's a narrow one. A tool is worth paying for where it removes a specific, recurring cost: the chasing, the manual roll-ups, the discovery in week ten that something broke in week four. The ROI of OKRs 2026 Benchmark Report puts the difference at 1:88 for purpose-built goal software against 1:25 for spreadsheets. Below are the seven use cases where that gap actually shows up.
What OKR Software Is Actually Fixing
Before the list, the failures worth measuring against. Each use case below addresses one of them directly.
None of these is a knowledge problem. Every team in that data knows what an objective is. What they lack is a system that surfaces drift, connects work to strategy, and keeps progress visible without someone chasing it — which is precisely what the seven use cases below describe.
1. Weekly Check-Ins That Run Themselves
Cycles routinely start well and decay by week three: updates arrive late, managers chase them, and the dashboard shows last month's reality. The habit is the highest-leverage thing in the entire framework — teams running a weekly check-in complete 43% more of their OKRs than teams reviewing monthly or ad hoc — and it's also the first thing to lapse when a quarter gets busy.
Software fixes this structurally rather than motivationally. An automated nudge fires on the same day each week without anyone scheduling it, narrative fields capture the why alongside the score, and trend views show direction rather than a single snapshot. The meeting stops being about collecting updates and becomes about acting on them.
2. Planning That Ends With Commitments
Quarterly planning drags when goals live across scattered documents and slide decks. Teams debate, nothing gets cut, and the session ends with a list nobody owns.
A structured planning flow forces the decisions: company objectives at the top, team goals cascading beneath them, everything visible in one workspace. It also catches the most common quality failure at the moment it can still be fixed — across 20,952 key results analysed on the OKRs Tool platform, 52% were tasks or KPIs rather than outcomes. Catching that in the planning session costs ten minutes; catching it at cycle end costs the quarter.
3. Alignment You Can See
Effort isn't progress when every team sets priorities in isolation. Marketing optimises one metric, product ships against another, and the misalignment only surfaces when the quarter closes short.
This is the single most common structural failure in goal-setting: 65% of teams admit their goals aren't clearly linked to company strategy. A live alignment map closes it without adding meetings — every team's key results visibly connected to the company objective above them, dependencies exposed before they collide, and misalignment obvious while it's still cheap to correct.
4. Retiring the Spreadsheet
Spreadsheets are fine for a first cycle and become a liability at scale: version confusion, no update history, and a file people dread opening. That dread is the signal you've outgrown it.
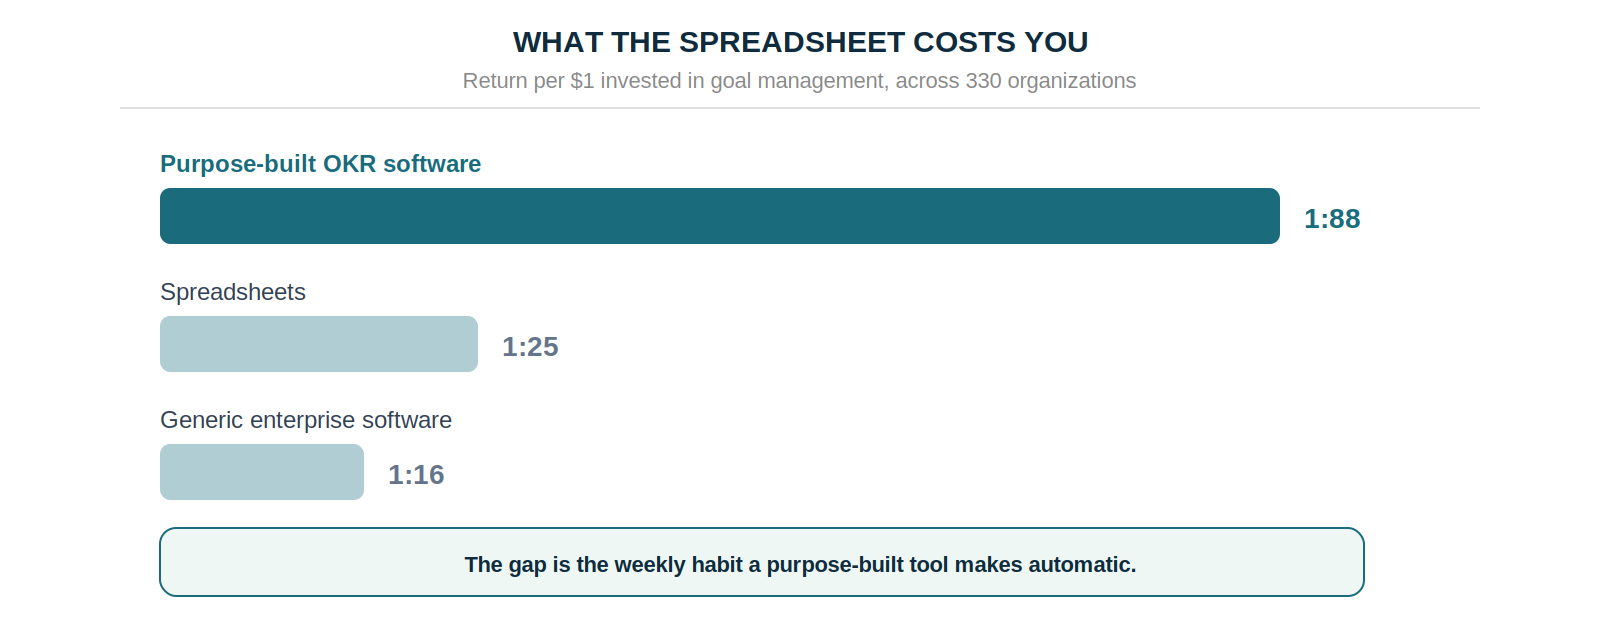
The return gap between a spreadsheet and a purpose-built tool is 1:25 against 1:88, and the mechanism isn't features. It's that ownership is centralised, history is retained automatically, and updating takes seconds rather than being a chore someone has to remember. The habit survives because the friction is gone.
5. Board and Investor Reporting
Board prep consumes days: exporting data, pasting screenshots, writing commentary from memory. The output is a snapshot that's already stale by the meeting.
Live dashboards remove the assembly work entirely — the numbers come from the same system the team updates weekly, the narrative fields supply the context behind them, and the structure stays consistent quarter to quarter so the board can see trend rather than a fresh format each time. The guide on showing OKR progress in board meetings covers presenting it in a way that earns trust.
6. Visibility Without Asking For It
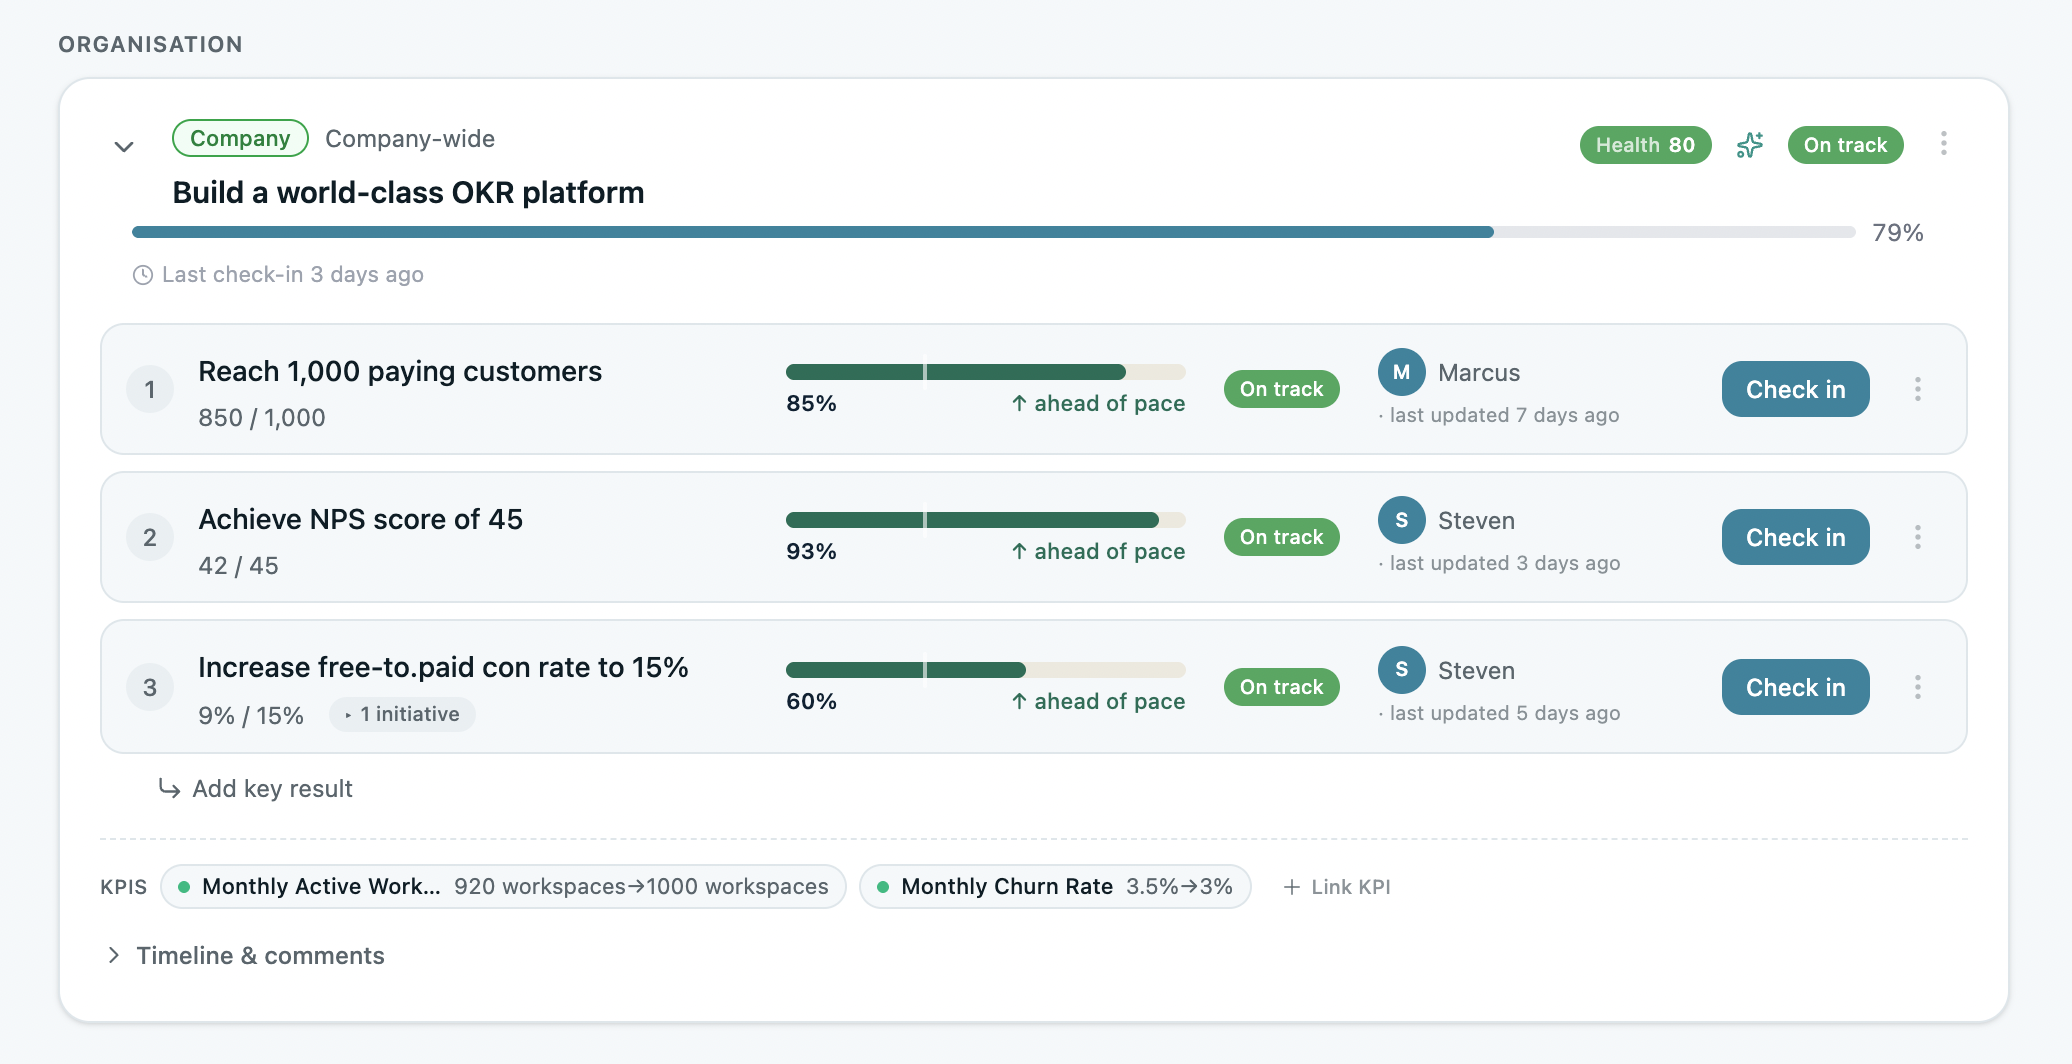
As headcount grows, knowing where execution is slipping gets structurally harder — and the data says leaders mostly don't know. 83% get no automatic signal when a priority drifts, and 62% say progress reaches them only when they go and ask for it. By the time a quarterly review surfaces the problem, the recoverable window has closed.
At-risk flagging mid-cycle changes the posture from reactive to preventive: what's stuck, what's accelerating, and where attention is needed this week rather than at the quarterly review. That's the visibility gap closing.
7. Adoption That Outlasts Cycle One
Programmes die when the habit stops holding: enthusiasm fades, updates stop, and the goals become documents nobody opens. Framework comprehension is almost never the missing piece.
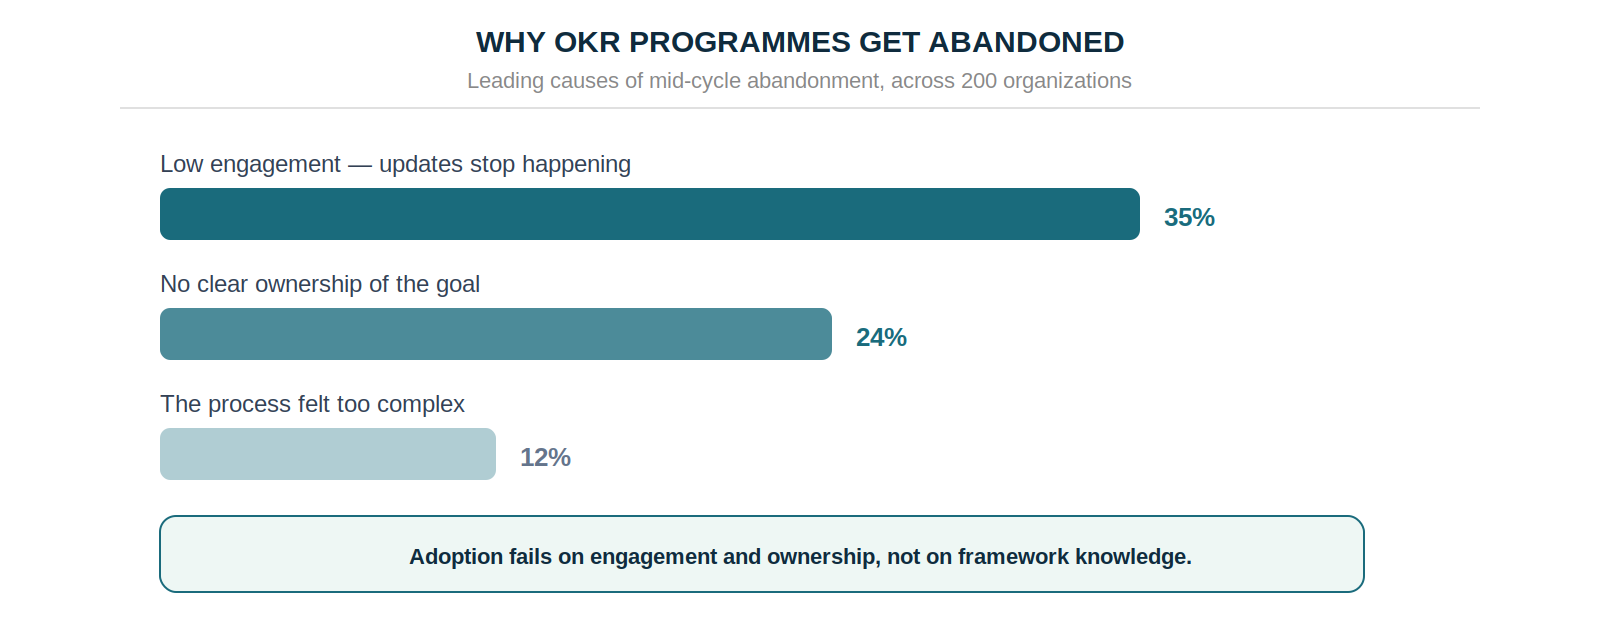
The abandonment data names the causes precisely: 35% of programmes die from low engagement, 24% from unclear ownership, 12% from process complexity. All three are addressable by design. Nudges arrive where people already work, ownership is required before a goal goes live, and the flow stays light enough that nobody needs training to use it. Adoption becomes a property of the system rather than a test of everyone's discipline.
The Seven Use Cases at a Glance
Treat that table as a menu rather than a checklist. The use case that justifies the spend is whichever failure is costing you most this quarter.
Start With the One That Hurts
OKR software is worth its cost in proportion to the specific problem it removes, which is why the seven cases above are worth more than a feature list. A team losing a day a quarter to board prep needs something different from a team whose check-in stopped happening in week three.
So pick the failure that's actually expensive right now — the stale spreadsheet, the invisible drift, the alignment that dissolved by week six — and solve that one. The 1:88 return isn't produced by adopting every use case at once; it comes from the weekly habit finally holding, which is what happens when the friction that killed it is designed out.
Data: The 2026 OKR Benchmark Report (200 organizations), The ROI of OKRs 2026 Benchmark Report (330 organizations), Strategy Execution Benchmark 2026 (180 strategy and operations leaders), OKRs Tool platform data (876 organizations, 20,952 key results).