
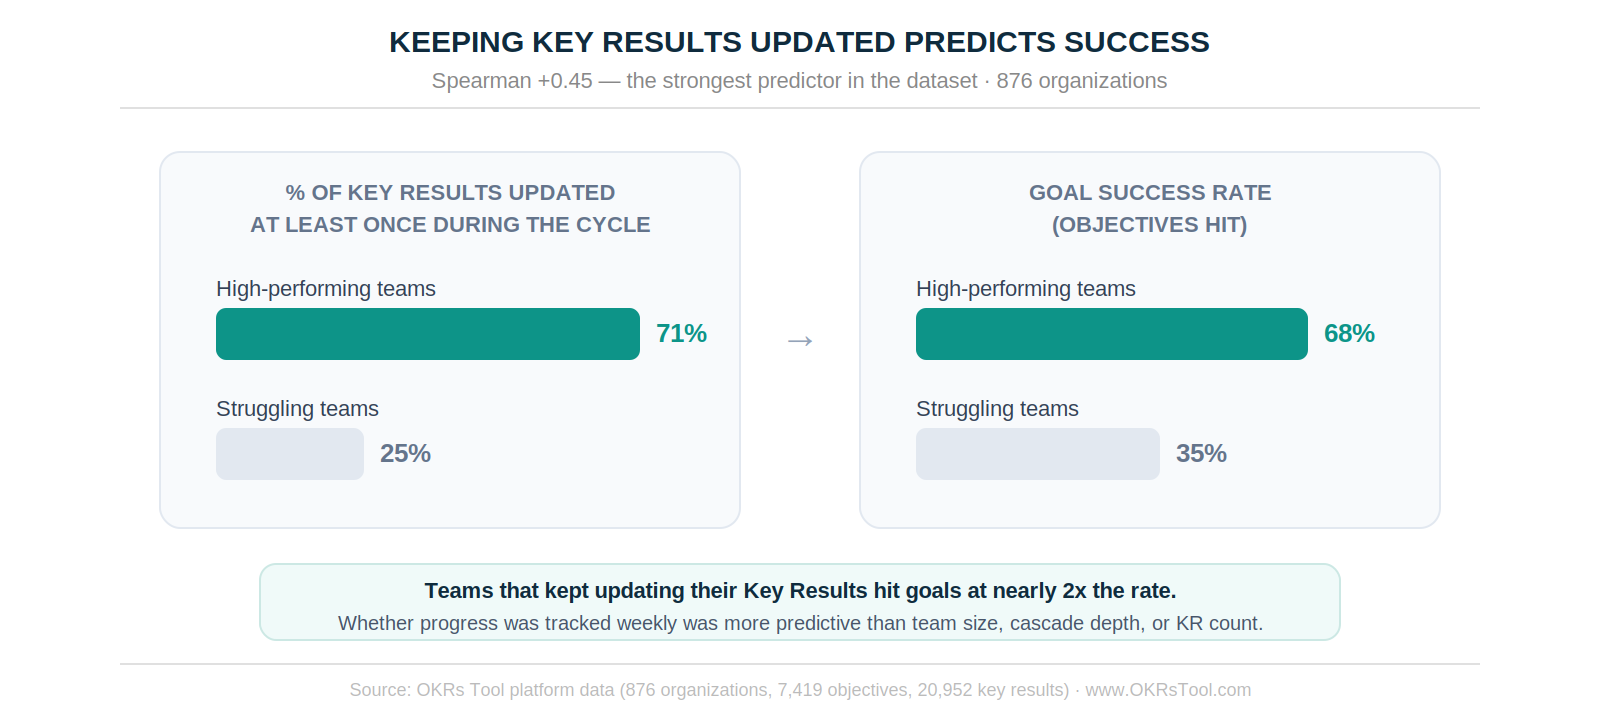
Across 876 organizations, 7,419 objectives, and 20,952 key results logged in OKRs Tool, one variable predicted goal success more reliably than anything else: whether teams kept their Key Results updated throughout the cycle. Teams that did hit goals at 68%. Teams that let their Key Results go dark hit them at 35% — roughly half the rate.
The gap between what teams say they do with OKRs and what they actually do is significant. A survey might tell you that 80% of teams check in weekly. Platform logs tell you what the timestamps actually say. This report is built on the latter — real behavior from real OKR cycles, not self-reported habits.
Where a finding is directionally clear but the sample is too small to put a precise number on it, we say so. The direction and the confidence level are both part of the finding.
Finding 1: The Teams That Hit Their Goals Kept Updating Their Numbers
Of everything measured in this dataset, one pattern stood out above everything else: did the team actually update their Key Results during the cycle, or did the numbers sit unchanged from week one to cycle end?
High-performing teams updated 71% of their Key Results at least once during the cycle. Struggling teams updated just 25% — less than a third. The success rate gap is direct: 68% of goals hit versus 35%.
The clearest version of this finding is the frozen objective. High-performing teams left only 4% of their objectives at zero progress throughout the entire cycle. Struggling teams left 31% stuck at zero — nearly a third of their goals never moved at all.
The implication is simple: an OKR that nobody updates is not being run. It exists on paper. The weekly check-in is the mechanism that prevents this — not because it produces insight, but because it forces the number to move.
Finding 2: Solo OKR Programs Almost Always Stall
The biggest gap in the dataset isn't between large and small teams. It's between solo users and anyone who has invited even one other person.
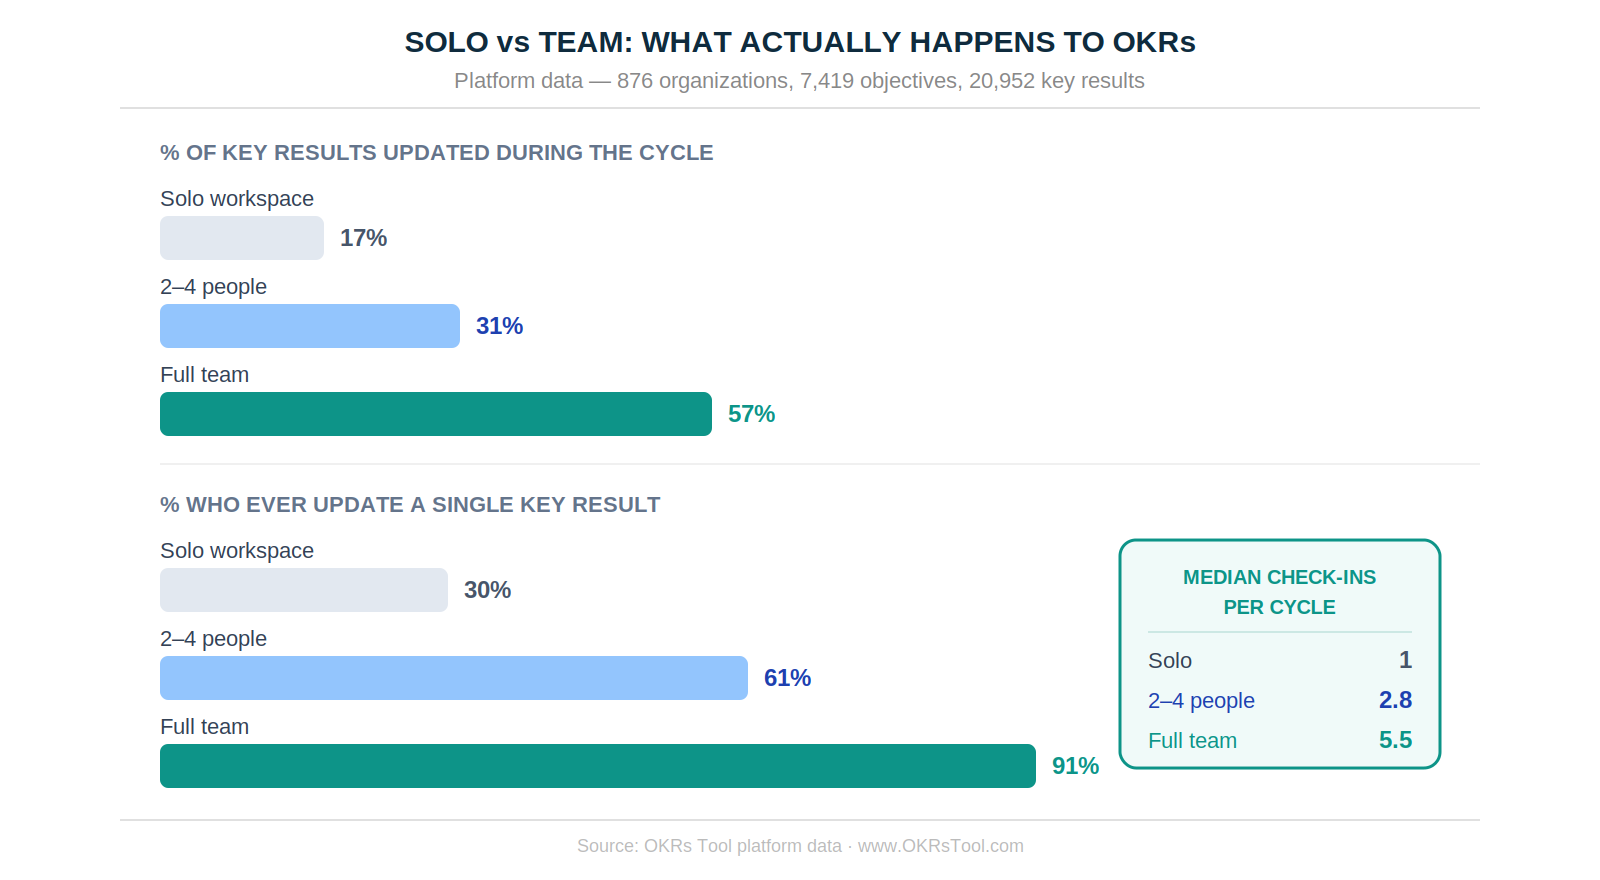
Solo workspaces update just 17% of their Key Results. Add two to four people and that climbs to 31% — an 83% jump. A full team reaches 57%.
The check-in numbers are even more stark. The typical solo workspace logs one check-in for the entire cycle, then goes quiet. The typical team logs 5.5.
The most striking number is how many solo programs ever do anything at all. Only 30% of solo workspaces update a single Key Result during their cycle. Seventy percent of solo OKR programs are effectively dead on arrival — the goals get written, the cycle starts, nothing moves. Add two people and that active rate more than doubles to 61%. A full team reaches 91%.
The mechanism is accountability. When one person owns a goal and nobody else can see whether it's moving, the rational behavior is to update it when it's convenient — which is often never. A second person changes that. Not because of peer pressure, but because the goal now exists in shared space rather than a private workspace nobody opens.
Finding 3: Experience Compounds
High-performing organizations had run a typical of ~20 OKR cycles. Struggling organizations had run a typical of ~7.
This is not just a selection effect — it's not simply that better organizations happen to run more cycles. Each cycle's retrospective tells the team which Key Results stalled, which Objectives were miscalibrated, and what to do differently in the next planning session. Teams with 20 cycles have applied that learning 20 times.
The maturity curve in the survey data — 51% completion in cycles 1–2 rising to 79% by cycle five — reflects the same thing. The organizations generating the strongest outcomes in this dataset treated OKR adoption as a multi-year operational commitment, not a quarterly experiment.

Finding 4: Fewer Key Results Per Goal, Better Results
High-performing organizations ran a typical of 2.9 Key Results per Objective. Struggling organizations ran 3.5.
The pattern is consistent: more Key Results per goal, worse outcomes. The reason is attention. A Key Result that a team updates and discusses every week competes with every other Key Result for the same focus. Three well-owned Key Results outperform four where attention is spread thin.
One specific pattern made outcomes worse: loading Key Results with numbers for their own sake — adding metrics to look rigorous rather than because those specific numbers actually measured whether the goal succeeded. The data showed that teams doing this underperformed teams that were more selective about what they measured.
Finding 5: Goals Built From Zero Outperform Goals That Move Existing Numbers
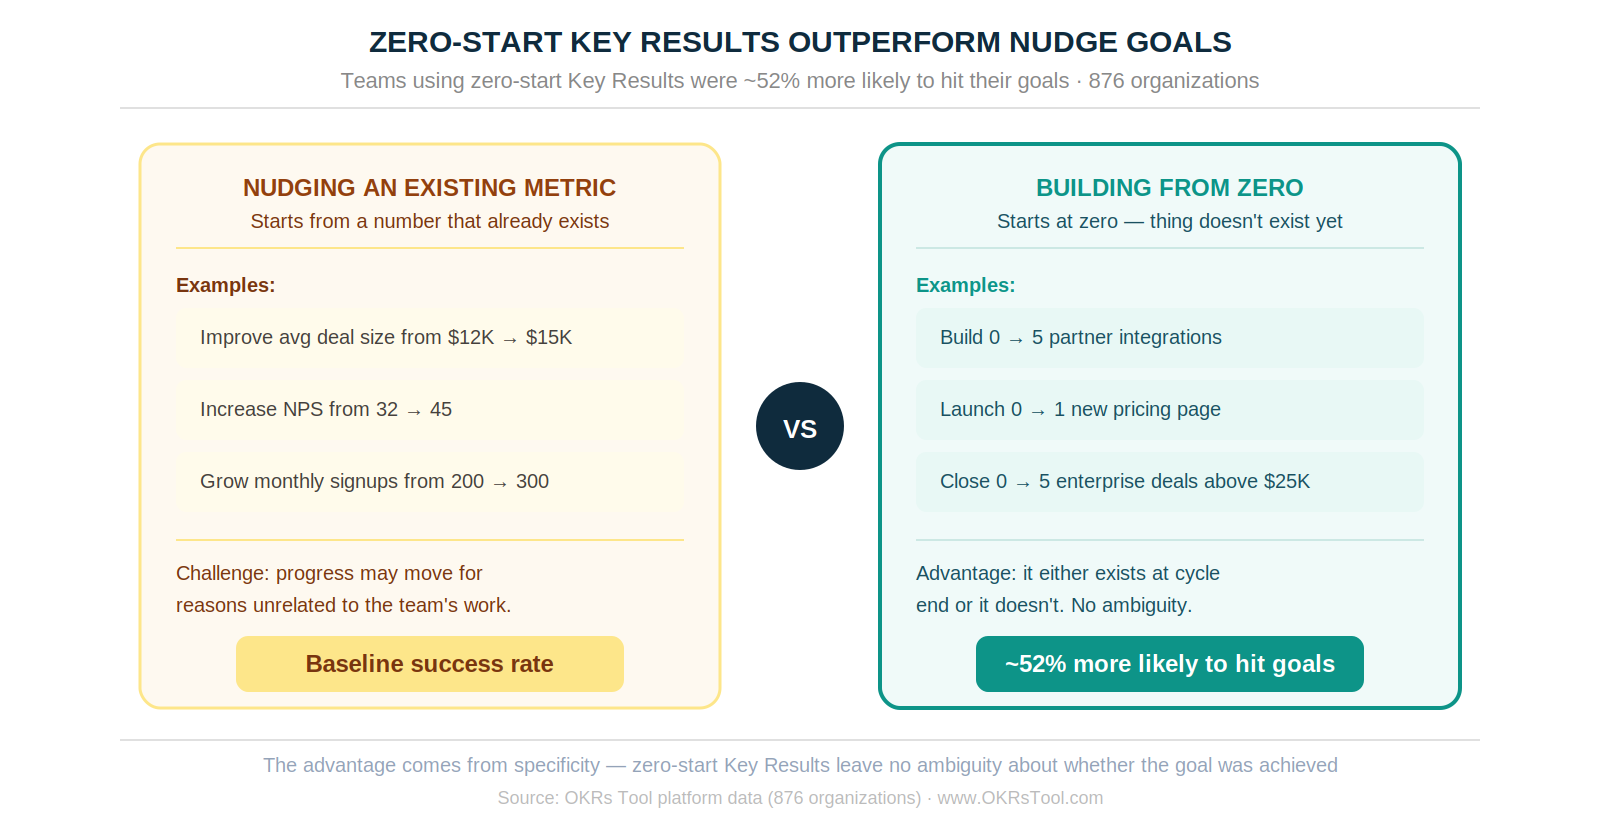
Teams whose Key Results tended to start from zero — "build 0 → 5 partner integrations," "launch 0 → 1 new pricing page" — were around 52% more likely to hit their goals than teams focused on nudging existing metrics upward.
The likely reason is clarity. A zero-start Key Result describes something that either exists at cycle end or it doesn't. There's no ambiguity about whether it was achieved. "Improve average deal size from $12K to $15K" might move for reasons unrelated to anything the team did. "Close 5 enterprise deals above $25K" doesn't.
This is a directional finding — teams shouldn't mechanically write all Key Results as zero-start goals. The useful read is that specificity is what matters. Zero-start Key Results tend to be more specific. The specificity is the thing that works.
What the Data Says Doesn't Help
The most counterintuitive finding concerns approval workflows — requiring goals to be reviewed and approved before the cycle can start.
Only 35% of high-performing organizations ran an approval workflow. Among struggling organizations, 62% ran one. More sign-off process was associated with worse outcomes, not better.
This doesn't mean approvals cause failure. It more likely reflects the type of environment the type of environment where heavy process is common: more hierarchy, less team-level ownership, goals that are negotiated upward through layers of sign-off rather than built and owned by the teams pursuing them. The data suggests that how goals are set — with genuine team ownership from the start — matters as much as what goals are set.
Multi-level cascade showed a modest positive pattern — present in 27% of high performers versus 12% of struggling organizations. It helps. But it's far less predictive than whether Key Results are being updated week over week. Structure without movement doesn't close the gap.
The Pattern Across Every Finding
Every strong finding in this dataset points to the same thing: OKRs that are actively updated and visible week over week produce dramatically better outcomes than OKRs that are set and left alone.
The specific habits that drive active tracking are well-documented in the 2026 OKR Benchmark Report — named single ownership per Key Result, automated weekly nudges, and a fast cycle launch. The platform data confirms the same conclusion from the behavioral side — not from what teams said, but from what the timestamps showed.
See how OKRs Tool's platform implements the structural habits this data identifies — named ownership, automated weekly check-ins, and honest end-of-cycle scoring — free for up to 5 users.
Data: OKRs Tool platform data (876 organizations, 7,419 objectives, 20,952 key results). The 2026 OKR Benchmark Report (200 organizations) and The OKR Intelligence Report 2026 (222 organizations) provide the survey-based findings referenced for comparison.