
A company can finish the quarter at 90% on its key results and move nothing — revenue flat, retention unchanged, the one product metric everyone called critical up by a rounding error. Nothing broke procedurally. The targets were simply never connected to the outcomes the business needed, and the data shows how common that is: only 7% of leaders say most daily work ladders up to strategy, and across 20,952 key results, 52% are satisfied by finishing the work rather than by changing anything.
OKRs in business work when a team can trace a clean line from its objectives to the outcomes the company needs. That line is missing almost everywhere. Objectives get written, key results get assigned, the all-hands slide goes up — and the number on the board climbs while the business it was meant to move stands still. This guide walks the data on why that happens and the specific habits that close the gap, drawn from four benchmark studies — including the OKR Benchmark Report — of more than 2,000 organizations.
The pattern matters most at 50 to 200 people, where a misaligned quarter doesn't just waste effort — it shapes hiring, pulls cross-functional resources, and bends the roadmap in ways that take two or three OKR cycles to unwind. Getting OKRs to drive strategy execution, rather than describe it, is one of the highest-leverage things a growing company can fix, and it sits inside the wider practice of goal setting that the research keeps returning to.
The Disconnect Is Wider Than Leaders Think
The laddering gap is measurable, and it runs wider than most leadership teams assume about their own company. The Strategy Execution Benchmark surveyed 180 strategy and operations leaders on how much of their teams' daily work actually connects to strategy.
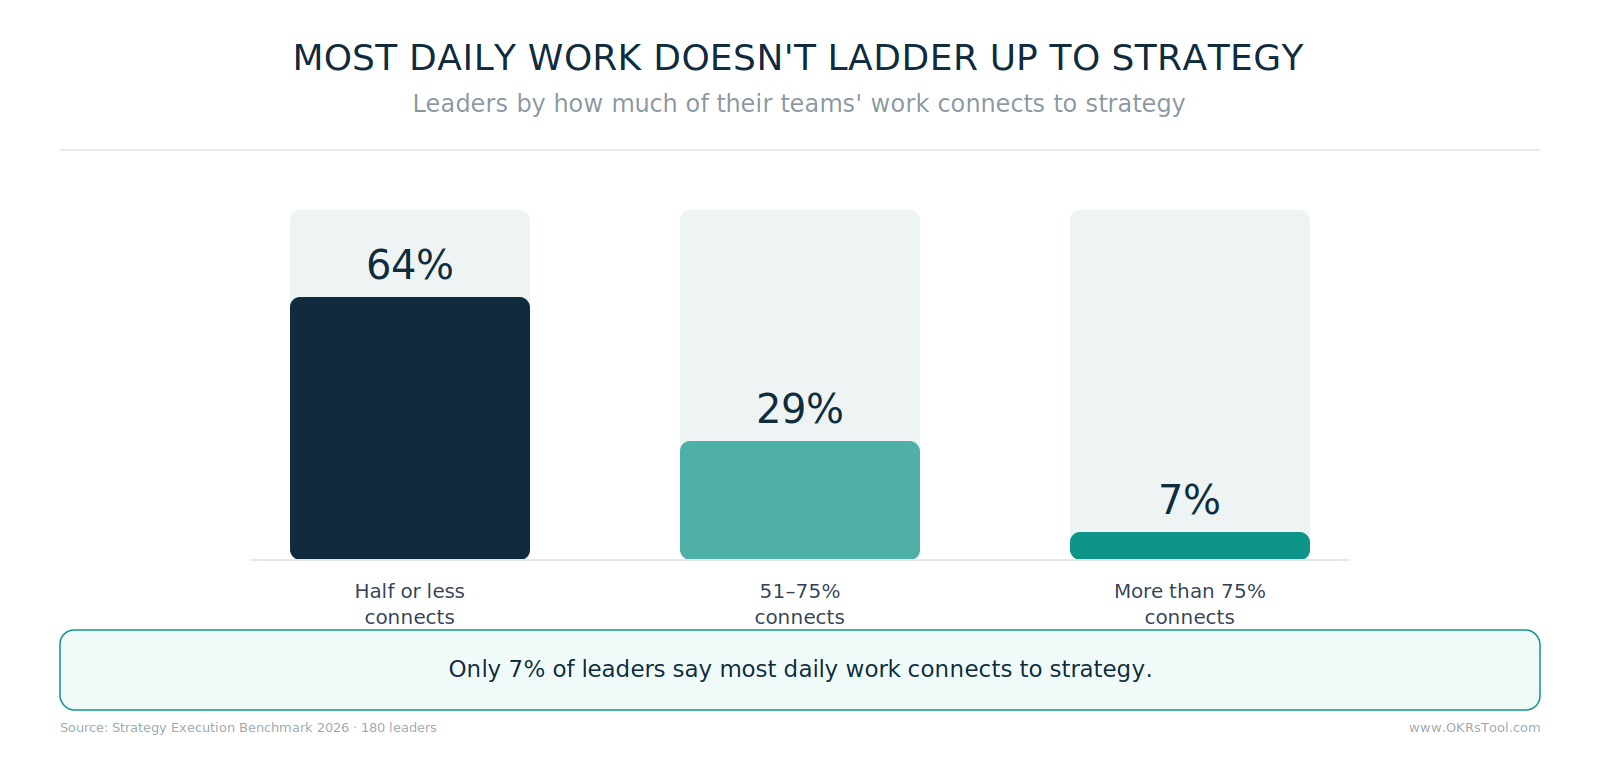
Nearly two-thirds — 64% — say half or less of their teams' daily work connects to strategy, and only 7% say most of it does. In the overwhelming majority of companies, a team can hit every key result on the board — a textbook case of output over outcome — while a meaningful share of what they did that quarter pointed at nothing the business needed.
The cascade from company priority to team goal is what prevents that, and it's the step rollouts skip most often — objectives get set without anyone drawing the line back up to a company objective. The cost of skipping it compounds, because 65% of teams already admit their goals aren't clearly linked to company strategy at all.
Effort Satisfies Half of All Key Results
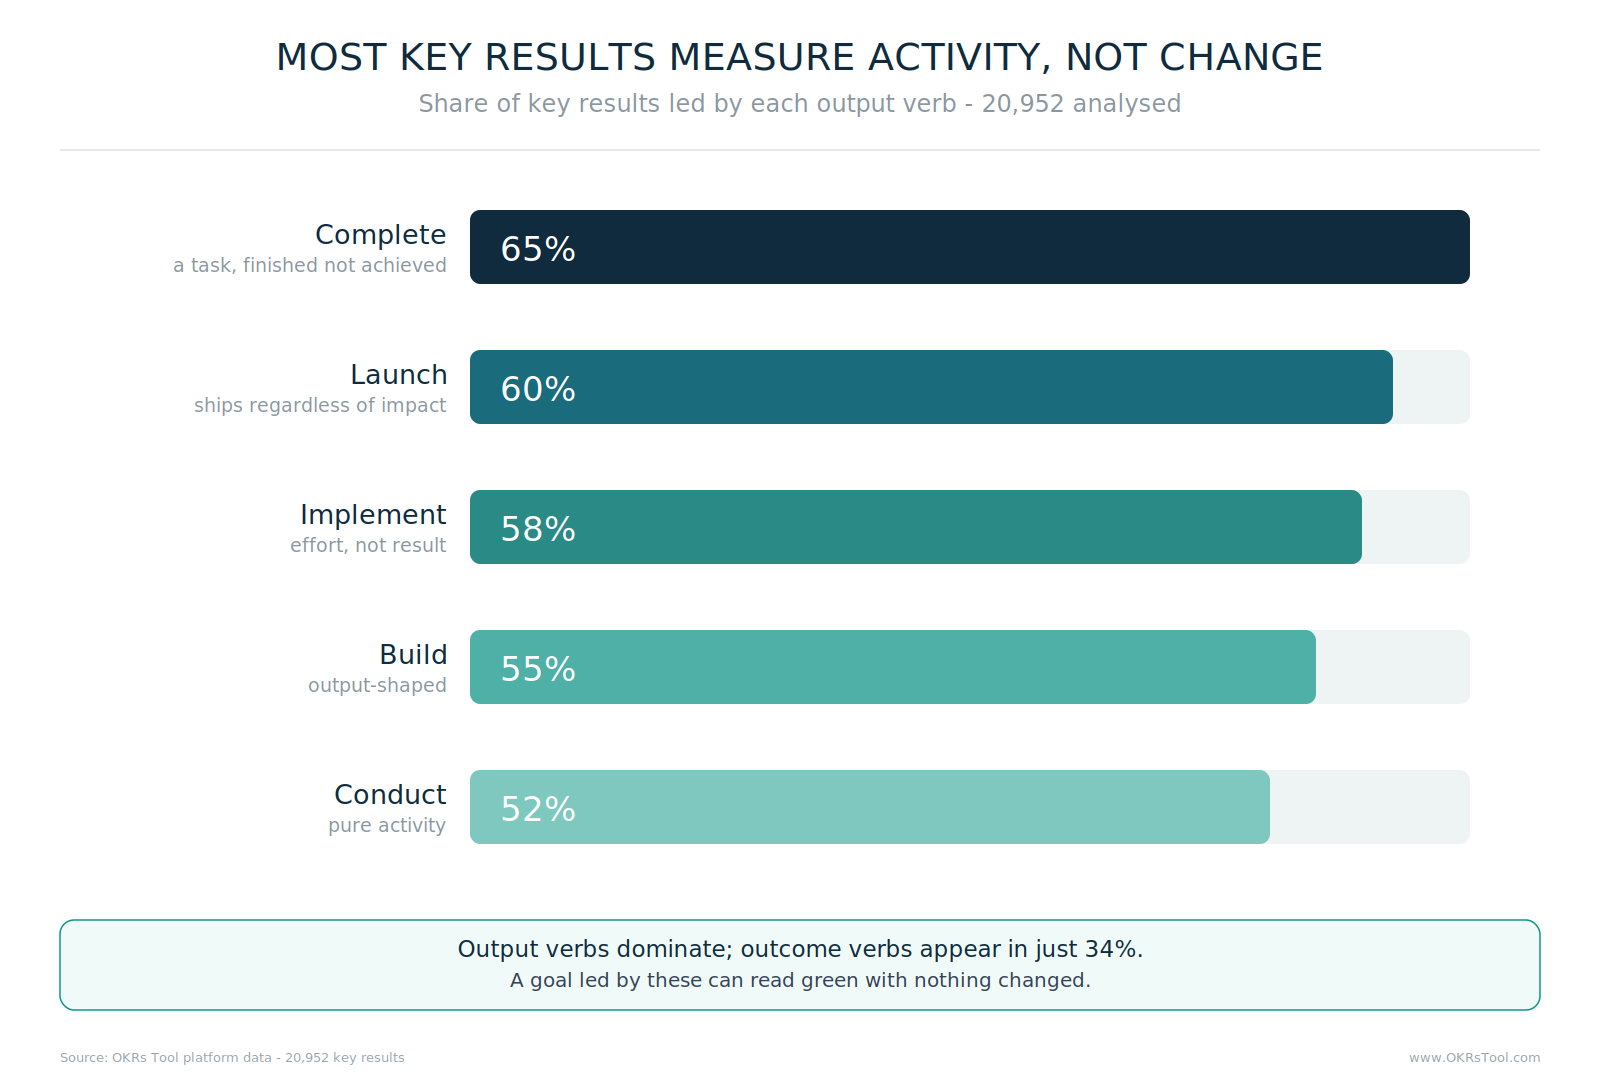
A second mechanism sits underneath the first, and it explains how the numbers stay green while the business stalls. Across 20,952 key results on the OKRs Tool platform, 52% turned out to be tasks or KPIs wearing the language of outcomes rather than measuring any real change.
"Launch the onboarding revamp" is satisfied by finishing it. "Increase day-7 activation from 34% to 52%" can fail even when all the work gets done. The first tracks effort; the second tracks whether anything worked. A board full of the first kind can't deliver bad news — it reads green as long as people are busy, which was never the question. That's the arithmetic behind a 90% quarter that moves nothing.
The tell is usually the verb. Key results starting with Complete, Launch, Implement, Build, or Conduct describe work being produced — finished, not achieved. Increase, Reduce, Improve, and Grow each imply a baseline, a target, and a direction, since you can't increase something without saying from what and to what.
Writing goals as outcomes rather than outputs is the single change that makes a board honest, and teams that do it hit their goals 30% more often, one of the clearest OKR best practices in the data.
The Framework Matters Less Than the Habits
It's tempting to blame the disconnect on the wrong framework — that a switch from OKRs to something else would fix it. The newest research says otherwise. The Goal-Setting Benchmark surveyed 280 operations and strategy leaders and found the framework a team runs is one of the weakest predictors of whether it hits its goals.
What predicted success was a stack of habits underneath the framework: reviewing weekly, tracking continuously, keeping goals visible, and running on real software. Stack three or four of those habits and a team lands its goals 2.9x as consistently as a team running none of them.
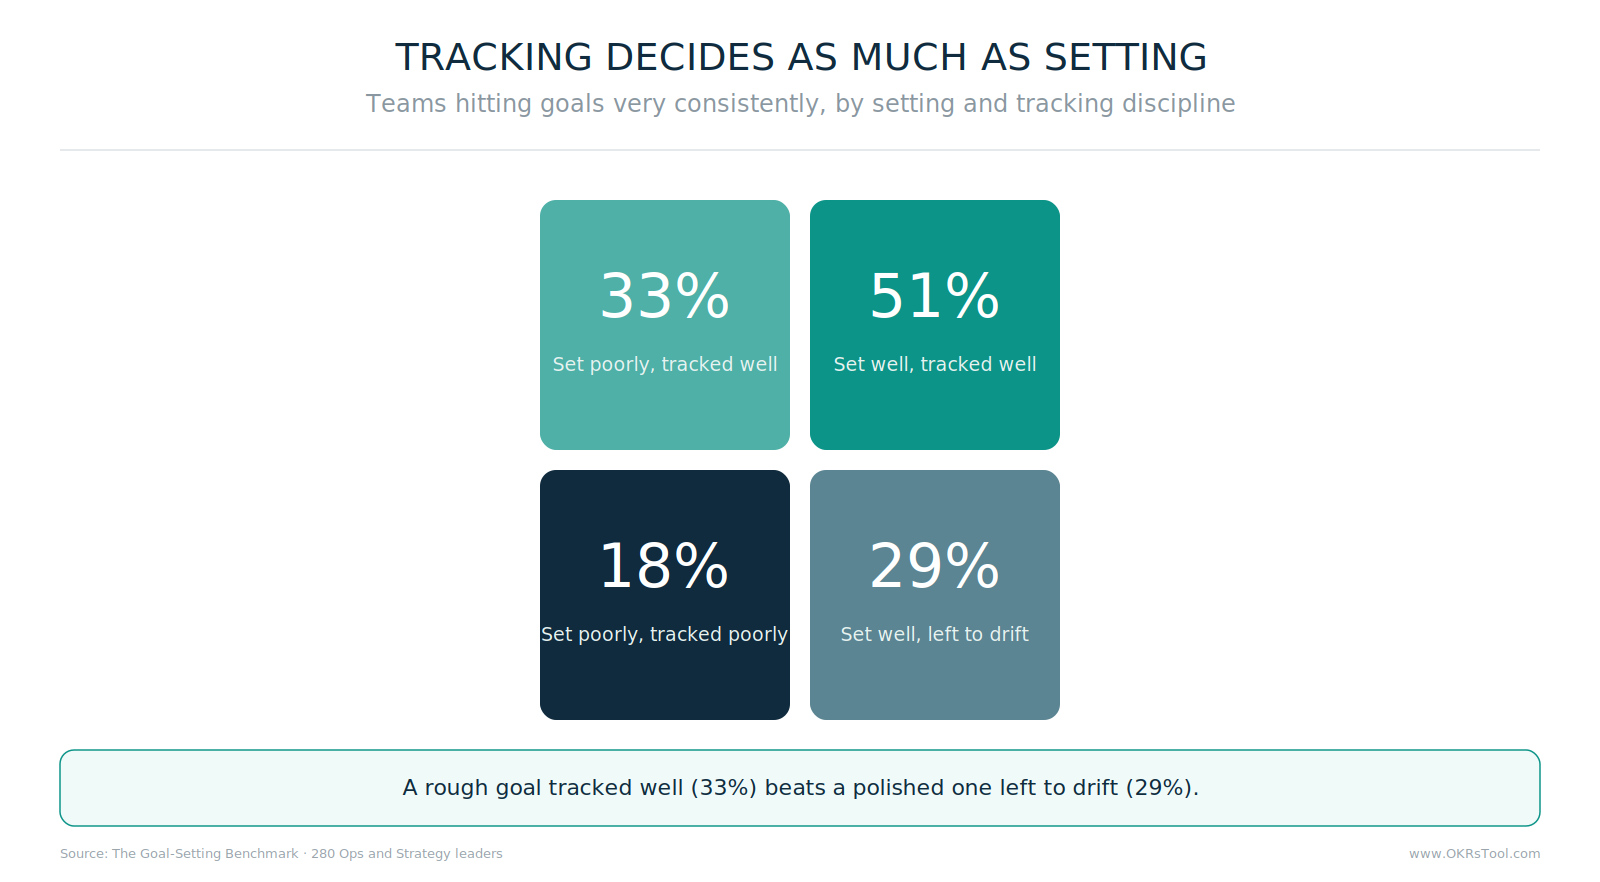
The benchmark's sharpest cut for business OKRs is the split between setting and tracking. Teams strong at both hit their goals very consistently 51% of the time; a goal set well but left to drift lands at 29%, barely above the 18% floor where neither is done well — while a roughly set goal tracked closely reaches 33%.
For a leadership team, that reorders the priority list: the effort usually spent perfecting objective wording against a framework returns less than the effort spent tracking whatever got written. The framework is the easy half of running OKRs in a business; the habits are the half that decides the outcome.
How the Cycle Erodes
When those habits are missing, the decay follows a pattern consistent enough to predict.
In quarter one, objectives get set with genuine energy — teams engage, ownership feels real, the planning session ends on a high. By quarter two, key results come in mixed, and the retro surfaces familiar themes: too many priorities, one of the clearest reasons OKRs fail, unclear ownership, objectives that drifted mid-quarter.
By quarter three, engagement drops, the planning session gets less honest input, and people write OKR examples that reflect what they're already doing rather than what the business needs them to change. The OKRs have slid into a formality — something to complete rather than something to care about.
Quarter three is also where the curve starts to bend upward for teams that stay with it. Average completion climbs from 51% in a team's first two cycles to 59% by cycles three and four, and 79% by the fifth, along the maturity curve. High performers had run a median of 20 cycles on a mature OKR process; struggling teams had run 7.
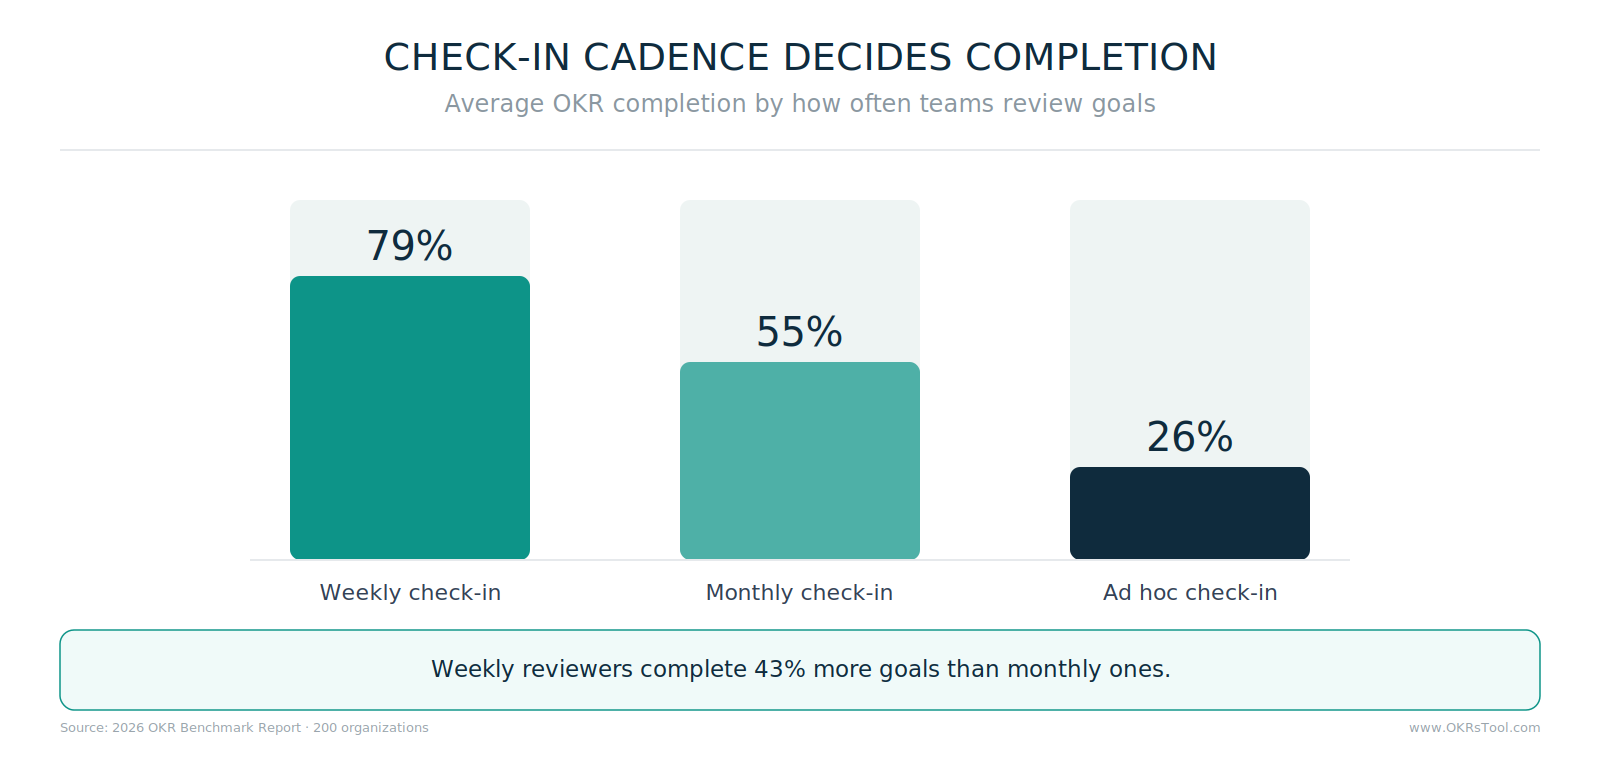
Teams that quit at cycle three abandon the framework at the precise point it was about to start paying, and they quit because the first two cycles felt disconnected — which is the fixable part. A weekly check-in on a steady cadence is what carries a team through that dip: teams with the habit complete 43% more goals than those reviewing monthly or ad hoc.
The Question That Never Gets Asked
The gap rarely lives in the objectives themselves — almost any team, pushed, can write a reasonable one. It lives in a conversation that never happens: what business outcome is this supposed to drive? Objectives get written to reflect what a team is working on; key results get chosen because they're measurable, not because hitting them produces something that matters. The OKR looks complete while staying decorative.
One question, asked at every level of goal-setting, closes most of that gap: if we hit this, what changes for the business? Not what does it measure, not is it achievable — what changes. What does the customer feel, what does revenue do, what does the team stop struggling with. If that question has no clear answer, the objective isn't ready. It's the same test that separates an outcome from an output, applied before the quarter starts rather than discovered at the end of it.
What Disconnection Costs After the Quarter
Missed targets are visible. The harder cost is what happens to a team's relationship with the framework when they hit their OKRs and nothing changes. Cynicism builds cycle over cycle: the next quarter gets less engagement, less real ownership, less willingness to set ambitious key results that might be missed. People learn — correctly — that the objectives aren't connected to anything, and they adjust.
The employee-level research shows where that ends. The State of Goal Management found a third of employees — 34% — would work exactly the same if their goal tracker vanished overnight, and 92% admit to at least one form of goal-gaming, from sandbagging to watermelon reporting. Those are people responding rationally to goals that were never load-bearing, and rebuilding that trust takes longer than losing it did. This is why goal-gaming is a structural problem rather than a people problem: the incentive to game a disconnected goal is built into the disconnection.
What Changes When the Connection Is Explicit
The companies that make OKRs stick run a more honest process, not a more sophisticated one. They start with the business outcomes they need and work backwards to the objectives that would produce them. When the connection is explicit, the dynamic shifts: teams stop asking whether they're on track and start asking whether it's working, managers stop reporting progress in the check-in meeting and start reporting impact, and the mid-cycle conversation changes from "here's where we are" to "here's what we're learning."
Three structural habits carry it, and each is worth a measurable lift.
None of it requires a new framework. It requires asking harder questions before the quarter starts, and rewriting the objective when the answer isn't good enough. It also requires the tracking to be continuous, not a monthly OKR review rather than reconstructed before a review — among teams already doing the weekly work, those on dedicated software hit their goals very consistently 74% of the time against 33% on spreadsheets.
Make the Line Visible
When objectives live in a doc, work lives somewhere else, and progress exists only in someone's head, the line between goal and outcome stays invisible by default. That's an architecture problem, and it's why 83% of leaders get no automatic signal when a priority drifts off track — the visibility gap that follows from it.
Closing the gap means making the thread legible: every initiative traceable to a key result, every key result traceable to a company objective, and the whole line visible on one platform to the people doing the work rather than only the people reviewing it.
An alignment map is what makes that connection something a team can see rather than something a leader hopes exists. When the connection is explicit, the question in a check-in changes from "did we do the work" to "did it move what we said it would," and the answer arrives while there's still a quarter left to act on it.
OKRs that drive the business run this way; OKRs that merely describe it skip it. Start with the business outcome, work back to the objective, put one name on each key result, score it honestly, review it weekly, and keep the whole line visible with continuous OKR tracking. Do that and a 90% quarter means something — because the 90% was tied to an outcome from the start, not discovered to be hollow at the end.
Data: the Strategy Execution Benchmark 2026 (180 strategy and operations leaders), the Goal-Setting Benchmark (280 operations and strategy leaders), OKRs Tool platform data (876 organizations, 20,952 key results), the 2026 OKR Benchmark Report (200 organizations), and the State of Goal Management (210 employees).