Teams average 51% OKR completion in their first cycle and 79% by their fifth — a 28-point climb that comes not from writing better goals, but from a compounding execution rhythm. The OKR Flywheel is the five-stage cycle — Create, Collaborate, Connect, Track, Reflect — that builds that rhythm, and separates teams generating a 1:25 ROI from those who abandon OKRs by week three.
Most teams treat OKRs as a planning event: set them in a workshop, file them, and reconstruct what happened at quarter's end. The goals that survive don't work that way. They run on a loop that turns each cycle's discipline into the next cycle's starting point — the OKR habits that separate a real program from a spreadsheet — and that loop is what the flywheel describes.
Each of the five stages has a specific job, and each one builds the conditions the next one needs. Together they solve the most consistent OKR failure pattern: goals that get set once, reviewed quarterly, and quietly abandoned in between.
The Data Behind the Flywheel
The case for the flywheel is in the OKR maturity curve. Teams in their first cycle average 51% OKR completion. By cycle five and beyond, that rises to 79%.
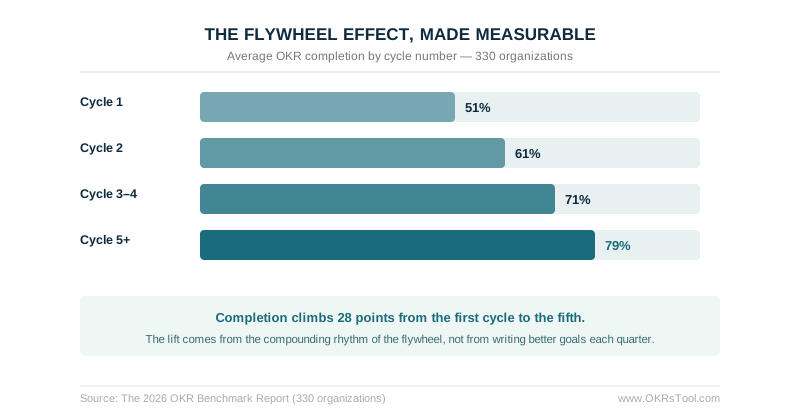
That 28-point climb doesn't come from writing better goals each quarter. It comes from the accumulated discipline of a weekly execution rhythm — and every stage of the flywheel is designed to build that rhythm faster. Across the 2026 OKR Benchmark Report of 330 organizations, the teams that reach the top of that curve are the ones that keep the loop turning cycle after cycle, not the ones that write the cleverest objectives.
What Is the OKR Flywheel?
The OKR Flywheel is the execution architecture built into OKRs Tool — a five-stage cycle that turns quarterly OKRs from a planning exercise into a team operating habit.
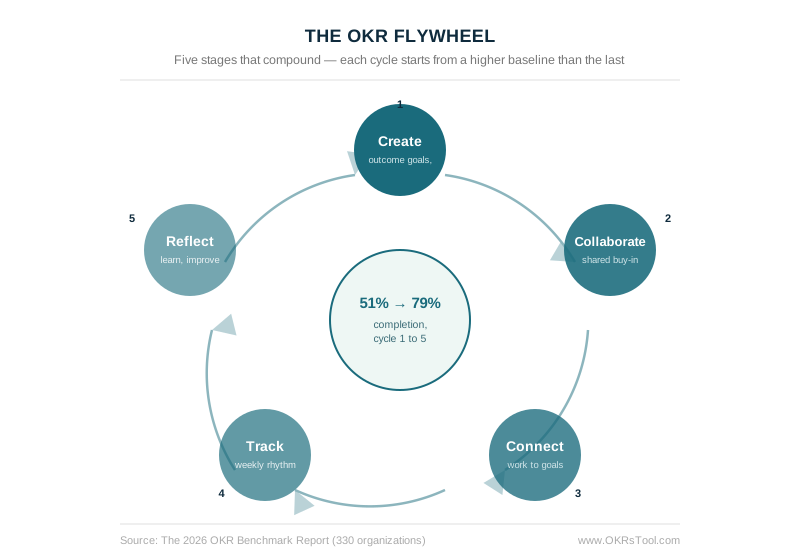
Each stage has a specific job. Together, they close the gap that kills most OKR programs: only about half of leaders review OKRs weekly, and the rest do so sometimes, rarely, or never. The flywheel is designed to make weekly engagement structurally automatic — not dependent on individual discipline.
Stage 1: Create — Start Fast With Outcome-Based Goals
Every OKR cycle begins with clarity, but clarity is hard to manufacture in a planning session when the team is staring at a blank page.
The Create stage is built for speed and quality at once. OKRs Tool generates role- and context-aware objectives and Key Results in seconds — outcome-based, not generic — and a library of examples by function gives teams a starting point that doesn't require an OKR coach to refine.
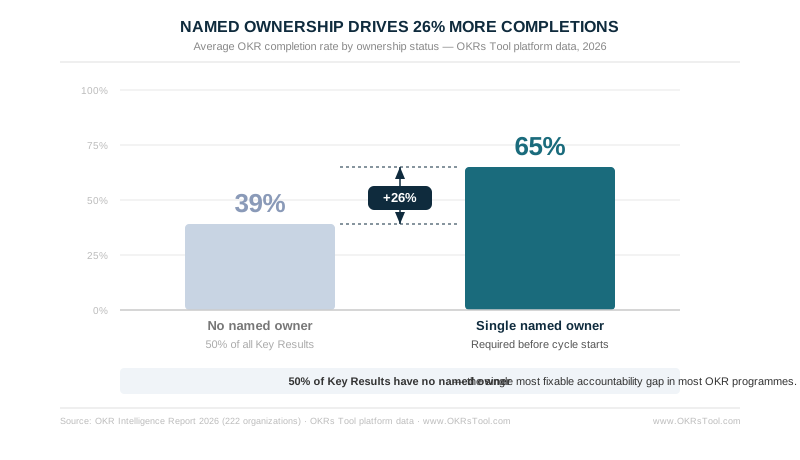
Speed matters more than it looks. Teams that launch OKRs in under a week see markedly higher completion than those that drag setup across several weeks; slow planning signals to the team that OKRs are optional before the first cycle even starts. One constraint is enforced before any goal goes live: every Key Result requires a single named owner.
It isn't a prompt — it's a hard gate, and teams with required single ownership complete 26% more of their goals than those with shared or vague accountability. It's also where a team decides which Key Results are committed versus aspirational, before the cycle locks in.
Stage 2: Collaborate — Turn Drafts Into Shared Commitments
A goal written by leadership and handed to the team is a directive. A goal written with the team is a commitment.
The Collaborate stage is where draft OKRs become shared ownership. Teams comment, refine, and align on goals directly in the platform — clarifying who owns what, which teams are contributing, and what success actually looks like before the cycle starts.
The alignment map makes the cascade visible: company OKRs connecting to department OKRs connecting to team Key Results. Every member can see how their commitment connects to the company's most important priority, without a separate alignment meeting. This matters because 65% of teams admit their goals aren't linked to company strategy — the Collaborate stage closes that gap before the cycle begins, not after four weeks of drift.
Stage 3: Connect — Link Goals to the Work That Moves Them
The most common reason OKRs drift mid-cycle: the goal lives in the OKR tool, the work lives in Jira or Slack or a project board, and nobody consistently connects the two.
The Connect stage ties Key Results to initiatives — the specific campaigns, sprints, and experiments the team believes will move the metric. High-performing teams attach two or three initiatives per Key Result in the first week of the cycle; teams that delay this step rarely recover the momentum.
The distinction is the whole point: the initiative is the work, and the Key Result is what the work is trying to change. Across the OKRs Tool platform of 876 organizations and 20,952 Key Results, 52% were tasks or KPIs in disguise — activity measures rather than outcomes. The Connect stage enforces the separation: work lives at the initiative layer, outcomes live at the Key Result layer. Slack and Microsoft Teams integrations surface status updates where the team already works, reducing the friction that causes mid-cycle updates to stop.
Stage 4: Track — Maintain Momentum Without Extra Meetings
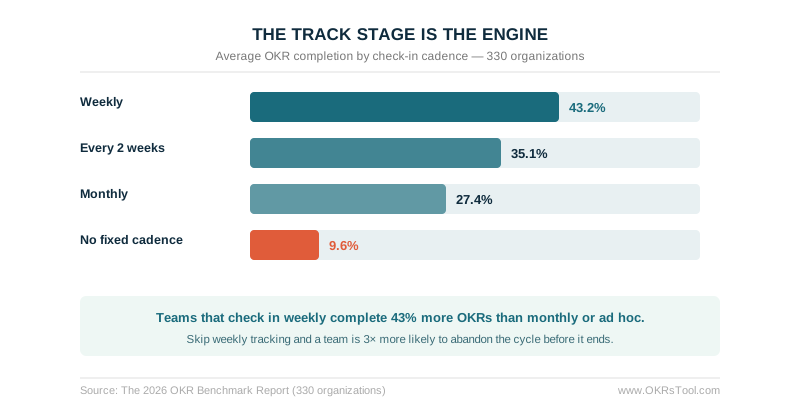
The benchmark data on what separates high-performing OKR programs is precise: teams that check in weekly complete 43% more OKRs than those reviewing monthly or ad hoc, and teams that skip weekly tracking entirely are 3× more likely to abandon OKRs altogether.
The Track stage makes the weekly habit automatic. Automated nudges go out via Slack or email at the same time every week — no manual scheduling, no chasing. Each Key Result owner spends two or three minutes updating status, adding a one-line note, and flagging any blockers.
An at-risk detection layer surfaces Key Results drifting off pace before they become misses. A Key Result that hasn't been updated in two weeks, or whose velocity projects it missing the target, gets flagged automatically — giving the team time to course-correct while there's still a quarter left. Leadership gets a live view of every objective's status — on track, at risk, or off track — without a status meeting to compile it.
Stage 5: Reflect — Build the Learning Loop That Compounds
The retrospective is where the flywheel becomes a compounding system rather than a quarterly planning cycle.
Teams that run structured end-of-cycle retrospectives complete 30–45% more OKRs the following quarter. The mechanism is straightforward: each cycle, the team writes better goals, assigns clearer ownership, and runs tighter check-ins because they've diagnosed what went wrong in the previous one.
The Reflect stage prompts four questions at cycle end: what did we achieve and what did we miss; what drove progress and what blocked it; what surprised us; and what we do differently next cycle. An automated cycle review synthesizes check-in patterns, completion rates, and ownership data into specific improvement suggestions — making the retrospective concrete rather than vague.
Without this stage, each cycle starts from the same baseline; with it, each cycle starts from a higher one. That compounding is what produces the 79% completion rate at cycle five.
Why the Flywheel Works
The five stages aren't independent best practices. They're a connected system — each one creating the conditions the next one needs.
Clear goals (Create) enable honest collaboration (Collaborate). Shared ownership enables initiative attachment (Connect). Live tracking enables honest weekly signal (Track). Honest signal enables useful retrospectives (Reflect). Useful retrospectives enable better goals next cycle, back to Create.
Break any stage and the whole loop degrades. Teams that set goals but skip weekly tracking produce stale OKRs. Teams that track weekly but skip the retrospective restart each cycle from scratch. Teams that collaborate but don't connect goals to initiatives produce activity reports, not outcomes. The flywheel works because the stages are mutually reinforcing — each rotation builds organizational muscle the next rotation starts from, and the compounding lift from cycle one to cycle five is that effect made measurable across 330 organizations.
Data: The 2026 OKR Benchmark Report (330 organizations) and OKRs Tool platform data (876 organizations, 20,952 key results).